
Dot Plots and Histograms
Dot plots and histograms are graphs that show how often values appear in a data set. A dot plot puts one dot above a number line for each value. A histogram groups the values into equal intervals and draws a bar for each one. The taller the stack or bar, the more values fall there.
Before this lesson: You should know mean, median, mode and range and how to read a number line. Percent questions use percentages.
What Dot Plots and Histograms Show
A list of numbers is hard to picture. A graph shows the shape of the data at a glance: where most values bunch up, where there are gaps, and whether there are outliers.
The number of times a value or interval appears is called its frequency. Both graphs show frequency. They just show it in different ways.
Dot Plots
A dot plot uses a number line. For each value in the data, you put one dot above that number. Repeated values stack up.
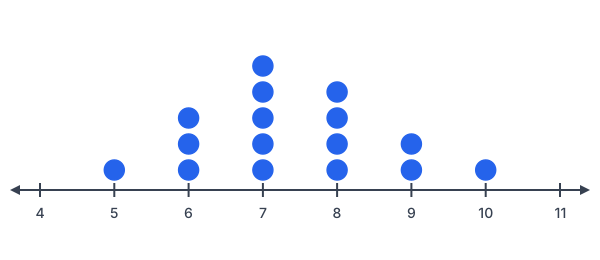
This dot plot shows how many hours 16 students slept. You can read every exact value from it. You can also count dots to find the mode, median and range.
Histograms
A histogram groups values into equal intervals, like 50–59, 60–69 and so on. Each bar’s height is the number of values in that interval. The bars touch, because the intervals have no gaps between them.
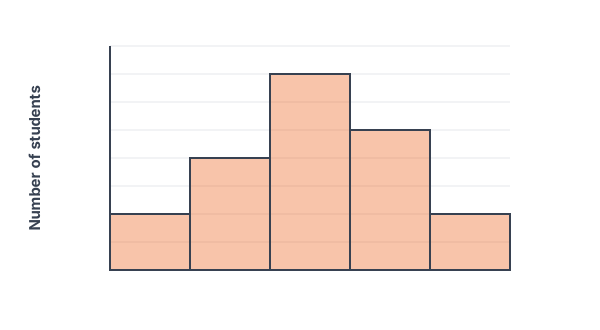
This histogram shows test scores for 20 students. You can see that most scores are in the 70s. But you can’t see the exact scores, only how many fall in each interval.
How to Make Each Graph
| Step | Dot plot | Histogram |
|---|---|---|
| 1 | Draw a number line that covers the smallest to largest value. | Choose equal intervals that cover all the data. |
| 2 | Put one dot above the number for each value. | Count how many values fall in each interval. A frequency table helps. |
| 3 | Stack repeated values in neat columns. | Draw a bar for each interval. Make the height equal the count. |
| 4 | Add a title and label the number line. | Make the bars touch. Label both axes and add a title. |
Worked Examples
Example 1: Read a dot plot
Use the hours-of-sleep dot plot. How many students slept 7 hours? How many slept 8 hours or more? What is the median?
Step 1. Count the dots above 7: there are 5.
Step 2. Add the dots above 8, 9 and 10: 4 + 2 + 1 = 7 students.
Step 3. There are 16 dots, so the median is the mean of the 8th and 9th values. Counting from the left: 1 dot at 5, then 3 at 6 (that’s 4), then 5 at 7 (that’s 9). The 8th and 9th values are both 7.
Answer: 5 students slept 7 hours, 7 students slept 8 or more hours, and the median is 7 hours.
Example 2: Make a dot plot
Twelve students took a 5-point quiz. Their scores were 3, 4, 5, 2, 4, 4, 3, 5, 4, 1, 3, 4. Make a dot plot.
Step 1. Count each score: 1 appears once, 2 once, 3 three times, 4 five times and 5 twice. That adds up to 12.
Step 2. Draw a number line from 1 to 5.
Step 3. Stack 1 dot above 1, 1 above 2, 3 above 3, 5 above 4 and 2 above 5.
Answer: The tallest stack is above 4, so 4 is the mode.
Example 3: Read a histogram
Use the test-score histogram. Which interval has the most scores? How many students scored below 70?
Step 1. The tallest bar is 70–79, with 7 students.
Step 2. Below 70 means the 50–59 and 60–69 bars: 2 + 4 = 6 students.
Answer: The 70–79 interval has the most scores, and 6 students scored below 70.
Example 4: Make a histogram
Twelve people’s commute times in minutes were 5, 12, 18, 22, 9, 15, 27, 14, 8, 19, 25, 11. Make a frequency table and histogram with intervals 0–9, 10–19 and 20–29.
Step 1. Sort into intervals. 0–9: 5, 9, 8 (3 values). 10–19: 12, 18, 15, 14, 19, 11 (6 values). 20–29: 22, 27, 25 (3 values).
Step 2. Check the total: 3 + 6 + 3 = 12.
Step 3. Draw three touching bars with heights 3, 6 and 3.
| Commute time (minutes) | Frequency |
|---|---|
| 0–9 | 3 |
| 10–19 | 6 |
| 20–29 | 3 |
Answer: The histogram has bars of 3, 6 and 3. Most commutes are 10–19 minutes.
Example 5: Word problem with test grades
In the test-score histogram, a score of 80 or more earns a B or better. What percent of the 20 students earned a B or better? Can you tell how many scored exactly 85?
Step 1. Add the 80–89 and 90–99 bars: 5 + 2 = 7 students.
Step 2. Write it as a percent: \frac{7}{20} = \frac{35}{100} = 35\%.
Step 3. A histogram only shows how many scores fall in each interval. It doesn’t show the exact scores.
Answer: 35% earned a B or better. You can’t tell how many scored exactly 85.
Common Mistakes with Dot Plots and Histograms
| Mistake | Example of the error | Fix |
|---|---|---|
| Leaving gaps between histogram bars | Drawing the bars apart like a bar graph | Histogram intervals connect, so the bars touch. |
| Using unequal intervals | Intervals 0–9, 10–14, 15–29 | Make every interval the same width, like 0–9, 10–19, 20–29. |
| Reading exact values from a histogram | “Two students scored 90” | The bar only says 2 scores are in 90–99. |
| Skipping numbers on a dot plot’s line | Leaving out 2 because no one scored 2 | Show every number in the range, even with no dots, so gaps are visible. |
| Counting a value twice in a histogram | Putting 10 in both 0–10 and 10–20 | Use intervals that don’t overlap, like 0–9 and 10–19. |
Dot Plot vs. Histogram
| Question | Dot plot | Histogram |
|---|---|---|
| Shows exact values? | Yes | No, only intervals |
| Best for | Small data sets with few different values | Large data sets or many different values |
| Can you find the median exactly? | Yes | Usually not, only which interval it’s in |
| What a dot or bar stands for | One value | How many values are in an interval |
Practice Problems
- In the hours-of-sleep dot plot, how many students are there in all?
- In the dot plot, how many students slept fewer than 7 hours?
- What is the mode of the hours-of-sleep data?
- In the test-score histogram, how many students scored 60–69?
- In the histogram, how many students scored less than 70?
- Make a frequency table for 2, 3, 3, 5, 6, 7, 7, 7, 9 using intervals 0–4 and 5–9.
- Make a frequency table for 31, 45, 38, 52, 47, 33, 41, 58 using intervals 30–39, 40–49 and 50–59.
- You want to show the exact number of goals scored in each of 12 soccer games. Should you use a dot plot or a histogram? Why?
Show answers
- 1 + 3 + 5 + 4 + 2 + 1 = 16 students
- 1 + 3 = 4 students slept 5 or 6 hours.
- 7 hours, the tallest stack.
- 4 students
- 2 + 4 = 6 students
- 0–4: 3 values (2, 3, 3). 5–9: 6 values (5, 6, 7, 7, 7, 9).
- 30–39: 3 (31, 38, 33). 40–49: 3 (45, 47, 41). 50–59: 2 (52, 58).
- A dot plot, because it shows each exact value. There are only a few games and a few different scores.
Dot Plots and Histograms FAQ
What is the difference between a histogram and a bar graph?
A histogram shows number data grouped into intervals, and its bars touch. A bar graph compares separate categories, like favorite colors, and its bars have gaps.
How do you find the mode from a dot plot?
Find the tallest stack of dots. The number under it is the mode.
Why do histogram bars touch?
The intervals cover the number line with no gaps, like 60–69 and then 70–79. Touching bars show that one interval runs into the next.
Summary
- A dot plot shows one dot for each value above a number line.
- A histogram groups values into equal intervals and draws touching bars.
- Frequency is how many times a value or interval appears.
- Dot plots show exact values. Histograms show only how many values are in each interval.
- Use a dot plot for small data sets and a histogram for large ones.
Previous lesson: Mean, Median, Mode and Range
Next lesson: Box Plots
Back to the Pre-Algebra (Math Basics) Index