
Box Plots
A box plot (also called a box-and-whisker plot) shows how a data set is spread out using five numbers: the minimum, the first quartile (Q1), the median, the third quartile (Q3) and the maximum. The box covers the middle half of the data. The whiskers reach out to the smallest and largest values.
Before this lesson: You should know how to find the median and range and how to read dot plots and histograms.
What a Box Plot Shows
A box plot splits the data into four parts. Each part holds about one quarter of the values. The box is the middle two quarters, so it holds about half of the data.
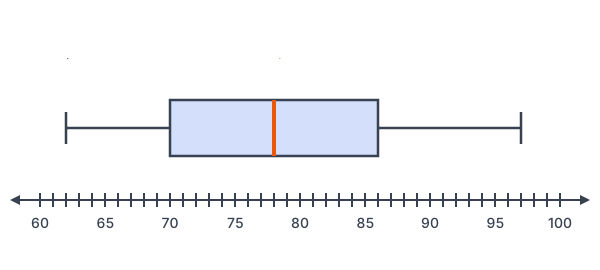
This box plot shows quiz scores for 11 students. A short box means the middle scores are close together. A long whisker means some values are far from the rest.
The Five-Number Summary
| Number | What it means | Quiz scores |
|---|---|---|
| Minimum | The smallest value | 62 |
| First quartile (Q1) | The median of the lower half | 70 |
| Median | The middle value | 78 |
| Third quartile (Q3) | The median of the upper half | 86 |
| Maximum | The largest value | 97 |
A quartile splits the data into quarters. The interquartile range (IQR) is the length of the box: \text{IQR} = Q3 - Q1. It tells how spread out the middle half of the data is.
How to Make a Box Plot
- Put the data in order from least to greatest.
- Find the median. It splits the data into a lower half and an upper half.
- Find Q1, the median of the lower half, and Q3, the median of the upper half. If there is an odd number of values, leave the median out of both halves.
- Draw a number line. Draw a box from Q1 to Q3 with a line at the median.
- Draw whiskers from the box out to the minimum and the maximum.
Worked Examples
Example 1: Five-number summary with an odd count
The quiz scores of 11 students are 62, 68, 70, 74, 75, 78, 81, 84, 86, 90, 97. Find the five-number summary and the IQR.
Step 1. The data is in order. The minimum is 62 and the maximum is 97.
Step 2. There are 11 values, so the median is the 6th: 78.
Step 3. The lower half is 62, 68, 70, 74, 75. Its median is Q1 = 70. The upper half is 81, 84, 86, 90, 97. Its median is Q3 = 86.
Step 4. \text{IQR} = 86 - 70 = 16.
Answer: 62, 70, 78, 86, 97, and the IQR is 16.
Example 2: Five-number summary with an even count
Eight students spent 3, 5, 6, 8, 9, 12, 14 and 20 minutes on a homework problem. Find the five-number summary.
Step 1. There are 8 values. The median is the mean of the 4th and 5th: \frac{8 + 9}{2} = 8.5.
Step 2. The lower half is 3, 5, 6, 8. Q1 is \frac{5 + 6}{2} = 5.5.
Step 3. The upper half is 9, 12, 14, 20. Q3 is \frac{12 + 14}{2} = 13.
Answer: minimum 3, Q1 5.5, median 8.5, Q3 13, maximum 20. The IQR is 13 - 5.5 = 7.5.
Example 3: Read a box plot
Use the quiz-score box plot. About what percent of students scored 86 or more? What percent scored between 70 and 86?
Step 1. 86 is Q3. The part from Q3 to the maximum is one quarter of the data, so about 25% scored 86 or more.
Step 2. The box, from 70 to 86, holds the middle two quarters, so about 50% scored between 70 and 86.
Answer: about 25% and about 50%
Example 4: Compare two box plots
Class A’s quiz scores have a median of 78 and an IQR of 16. Class B’s have a median of 82 and an IQR of 8. Which class did better? Which was more consistent?
Step 1. Class B has the higher median, so a typical student in Class B scored higher.
Step 2. Class B has the smaller IQR, so the middle half of its scores are closer together.
Answer: Class B did better and was more consistent.
Example 5: Word problem with temperatures
The high temperatures for 9 days were 55, 61, 58, 64, 70, 59, 66, 62 and 73 °F. Find the five-number summary and IQR.
Step 1. Put them in order: 55, 58, 59, 61, 62, 64, 66, 70, 73.
Step 2. The median is the 5th value, 62.
Step 3. Lower half: 55, 58, 59, 61, so Q1 = \frac{58 + 59}{2} = 58.5. Upper half: 64, 66, 70, 73, so Q3 = \frac{66 + 70}{2} = 68.
Step 4. \text{IQR} = 68 - 58.5 = 9.5.
Answer: 55, 58.5, 62, 68, 73 °F, with an IQR of 9.5 °F.
Common Mistakes with Box Plots
| Mistake | Example of the error | Fix |
|---|---|---|
| Not ordering the data first | Finding the median of 55, 61, 58, 64, 70 as 58 | Sort first: 55, 58, 61, 64, 70. The median is 61. |
| Including the median in both halves | For 11 values, using 6 values in each half | With an odd count, leave the median out of both halves. |
| Thinking a longer section has more data | “The right whisker is long, so most scores are high” | Each section holds about a quarter of the data. A long section just means those values are spread out. |
| Mixing up range and IQR | Giving 97 − 62 = 35 as the IQR | The IQR is Q3 − Q1: 86 - 70 = 16. The range is max − min. |
| Reading the median as the middle of the box | Saying the median is 78 because it’s centered | The median line can be anywhere in the box. Read its value from the number line. |
Box Plots vs. Other Graphs
A box plot hides individual values but makes the spread easy to compare. That makes it great for comparing two or more groups side by side. A dot plot shows every value, and a histogram shows the shape of a large data set.
Practice Problems
- Find the five-number summary of 2, 4, 5, 7, 8, 10, 13.
- Find the IQR of the data in Problem 1.
- Find the median, Q1 and Q3 of 10, 12, 15, 18, 20, 25.
- For the data in Problem 3, find the range and the IQR.
- In the quiz-score box plot, about what fraction of scores is below 70?
- In the quiz-score box plot, what is the median?
- True or false: the box in a box plot holds about half of the data.
- Nine bowling scores were 120, 135, 128, 150, 142, 131, 160, 138 and 125. Find the five-number summary and IQR.
Show answers
- Minimum 2, Q1 4, median 7, Q3 10, maximum 13.
- 10 - 4 = 6
- Median \frac{15 + 18}{2} = 16.5. Lower half 10, 12, 15, so Q1 = 12. Upper half 18, 20, 25, so Q3 = 20.
- Range 25 - 10 = 15. IQR 20 - 12 = 8.
- About \frac{1}{4}, because 70 is Q1.
- 78
- True. The box runs from Q1 to Q3, which holds the middle half.
- In order: 120, 125, 128, 131, 135, 138, 142, 150, 160. Median 135, Q1 \frac{125 + 128}{2} = 126.5, Q3 \frac{142 + 150}{2} = 146, minimum 120, maximum 160. IQR 146 - 126.5 = 19.5.
Box Plot FAQ
What are the five numbers in a box plot?
The minimum, first quartile (Q1), median, third quartile (Q3) and maximum. Together they are called the five-number summary.
How do you find the interquartile range?
Subtract the first quartile from the third quartile: \text{IQR} = Q3 - Q1. It is the length of the box.
What percent of the data is in the box?
About 50%. Each whisker and each half of the box holds about 25% of the data.
Summary
- A box plot shows the five-number summary: minimum, Q1, median, Q3 and maximum.
- Q1 and Q3 are the medians of the lower and upper halves.
- The box holds the middle half of the data, and its length is the IQR.
- Each of the four sections holds about one quarter of the data.
- Box plots are great for comparing groups.
Previous lesson: Dot Plots and Histograms
Next lesson: Probability
Back to the Pre-Algebra (Math Basics) Index