
Line of Best Fit
A line of best fit is a straight line drawn through the middle of the points on a scatter plot. It shows the overall trend of the data. You can write its equation in slope-intercept form, y = mx + b, and use it to make predictions. It is also called a trend line or line of fit.
Before this lesson: You should know scatter plots and correlation, slope-intercept form and writing equations in slope-intercept form.
Extra practice: The Algebra 1 Unit 10 Practice Pack has printable problems, answer keys and a cheat sheet for this unit.
What Is a Line of Best Fit?
Real data almost never falls exactly on a line. But when a scatter plot shows a linear pattern, one line can sum it up. That line is the line of best fit.
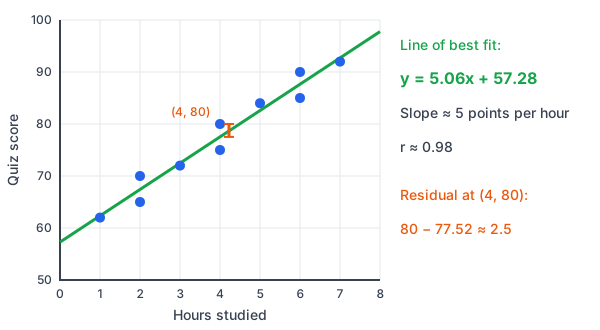
Here is the study-time data from the last lesson. The line runs through the middle of the cloud, with some points above it and some below.
| Hours studied | 1 | 2 | 2 | 3 | 4 | 4 | 5 | 6 | 6 | 7 |
|---|---|---|---|---|---|---|---|---|---|---|
| Quiz score | 62 | 65 | 70 | 72 | 75 | 80 | 84 | 85 | 90 | 92 |
How to Find a Line of Best Fit
By eye
- Make a scatter plot and check that the pattern looks linear.
- Draw a straight line through the middle of the points. Try to have about as many points above it as below.
- Pick two points on your line. They don’t have to be data points.
- Find the slope: m = \frac{y_2 - y_1}{x_2 - x_1}.
- Use one point to find b, and write y = mx + b.
With a calculator
A graphing calculator or app can find the exact line of best fit. This is called linear regression. For the study data, it gives y = 5.06x + 57.28 with r \approx 0.98.
What the slope and y-intercept mean
The slope is the rate of change. Here, each extra hour of study goes with about 5 more points on the quiz. The y-intercept, 57.28, is the predicted score for 0 hours of study.
Worked Examples
Example 1: Write an equation for a line drawn by eye
A student draws a line of fit for the study data. It passes through (1, 62) and (7, 92). Write its equation.
m = \frac{92 - 62}{7 - 1} = \frac{30}{6} = 5Step 1. Find the slope with the slope formula.
62 = 5(1) + b
Step 2. Put the slope and the point (1, 62) into y = mx + b (see slope-intercept form).
62 = 5 + b
Step 3. Multiply.
57 = b
Step 4. Subtract 5 from both sides (see one-step equations).
y = 5x + 57
Step 5. Write the equation.
Answer: y = 5x + 57. It is very close to the calculator’s line.
Check: The other point fits: 5(7) + 57 = 35 + 57 = 92.
Example 2: Interpret the slope and y-intercept
Use y = 5.06x + 57.28. What do 5.06 and 57.28 mean?
Step 1. The slope is the change in y for each 1 that x goes up. Here, each extra hour of study goes with about 5.06 more points.
y = 5.06(0) + 57.28
Step 2. The y-intercept is the value of y when x = 0. Substitute 0 for x.
y = 57.28
Step 3. Simplify. A student who studies 0 hours is predicted to score about 57.28.
Answer: Each extra hour goes with about 5 more points, and a student who doesn’t study is predicted to score about 57.
Example 3: Make a prediction
Predict the score for a student who studies 5.5 hours.
y = 5.06(5.5) + 57.28
Step 1. Substitute x = 5.5 into the line (see evaluating algebraic expressions).
y = 27.83 + 57.28
Step 2. Multiply first (see operations with decimals).
y = 85.11
Step 3. Add.
Answer: The predicted score is about 85.
Example 4: Find a residual
A residual is the actual value minus the predicted value. Find the residual for the point (4, 80).
5.06(4) + 57.28 = 20.24 + 57.28
Step 1. Find the predicted value. Substitute x = 4 and multiply.
20.24 + 57.28 = 77.52
Step 2. Add.
80 - 77.52 = 2.48
Step 3. Subtract: actual minus predicted.
Step 4. The residual is positive, so the point is above the line.
Answer: The residual is about 2.5.
Check: For the point (4, 75), the residual is 75 - 77.52 = -2.52. It is negative, so that point is below the line.
Example 5: When not to trust a prediction
Use the line to predict the score for 10 hours of study.
y = 5.06(10) + 57.28 = 50.6 + 57.28
Step 1. Substitute x = 10 and multiply.
y = 107.88
Step 2. Add.
Step 3. Compare with the data. A quiz score can’t be more than 100, and the data only goes up to 7 hours.
Step 4. Predicting far outside the data is called extrapolation. The line may not hold there.
Answer: The prediction, about 108, doesn’t make sense. Predicting inside the data is safer.
Common Mistakes
| Mistake | Example of the error | Fix |
|---|---|---|
| Joining the first and last points | Drawing the line from the lowest point to the highest | Go through the middle of all the points, with about as many above as below. |
| Trying to hit every point | Bending the line to touch each dot | A line of best fit is straight. Most points will be off the line. |
| Residual with the wrong sign | Residual = predicted − actual | Residual = actual − predicted. A positive residual means the point is above the line. |
| Trusting predictions far from the data | Predicting a quiz score of 108 | Only predict inside or close to the data’s range. |
| Mixing up slope and r | Saying the slope is 0.98 | r shows how strong the fit is. The slope is the rate of change, here 5.06. |
Practice Problems
Problems 1 to 7 use this data. A café records the outside temperature (°F) and cups of hot cocoa sold.
| Temperature (°F) | 40 | 45 | 50 | 55 | 60 | 65 | 70 |
|---|---|---|---|---|---|---|---|
| Cups sold | 50 | 47 | 40 | 37 | 30 | 27 | 20 |
- What type of correlation does the data show?
- A line of fit passes through (40, 51) and (70, 21). Write its equation.
- What does the slope of your line mean?
- Use your line to predict cups sold at 58°F.
- Find the residual for the point (50, 40) using your line.
- A calculator gives y = -1.00x + 90.86. Use it to predict cups sold at 62°F.
- Would it make sense to use the line to predict sales at 100°F? Explain.
- Line A has residuals 3, −2 and 1. Line B has residuals 6, −5 and 4 for the same points. Which line fits better?
- For the study data, what does the y-intercept of y = 5x + 57 mean?
Show answers
1.
As the temperature goes up, cocoa sales go down, and the points are close to a line (see scatter plots and correlation)
A strong negative correlation.
2.
m = \frac{21 - 51}{70 - 40} = \frac{-30}{30} = -1Find the slope.
51 = -1(40) + b
Put the slope and (40, 51) into y = mx + b.
51 = -40 + b
Multiply.
91 = b
Add 40 to both sides.
y = -x + 91
Write the line.
Check: -70 + 91 = 21.
3.
The slope is -1 cup per degree
For each 1°F warmer, the café sells about 1 fewer cup of cocoa.
4.
y = -58 + 91
Substitute x = 58.
y = 33
Add.
About 33 cups.
5.
-50 + 91 = 41
Find the predicted value at x = 50.
40 - 41 = -1
Subtract: actual minus predicted.
The residual is -1, so the point is 1 cup below the line.
6.
y = -1.00(62) + 90.86 = -62 + 90.86
Substitute x = 62 and multiply.
y = 28.86
Add.
About 29 cups.
7.
y = -100 + 91 = -9
Substitute x = 100.
You can’t sell a negative number of cups
100°F is far outside the data (40°F to 70°F), so this is extrapolation
No.
8.
|3| + |-2| + |1| = 3 + 2 + 1 = 6
Add the sizes of Line A’s residuals.
|6| + |-5| + |4| = 6 + 5 + 4 = 15
Add the sizes of Line B’s residuals.
Smaller residuals mean the points are closer to the line
Line A fits better.
9.
5(0) + 57 = 57
The y-intercept is the value when x = 0.
A student who studies 0 hours is predicted to score 57.
Want more practice? The Algebra 1 Unit 10 Practice Pack has 37 pages of problems on this and the other lessons in the unit, with step-by-step answers and a cheat sheet.
FAQ
How do you find the line of best fit?
Draw a line through the middle of the points, then use two points on it to find the slope and y-intercept. For an exact line, use linear regression on a calculator.
What is the difference between a line of best fit and linear regression?
Linear regression is a method for finding the line of best fit. It finds the line that keeps the residuals as small as possible.
What is a residual?
It is the actual y-value minus the predicted y-value. Positive residuals are above the line, and negative ones are below it.
Can a line of best fit go through none of the points?
Yes. It only needs to follow the overall trend. It may pass through some points, or none at all.
Summary
- A line of best fit shows the trend in a scatter plot.
- Draw it through the middle of the points, or use linear regression.
- Write it as y = mx + b. The slope is the rate of change.
- A residual is actual minus predicted.
- Predictions are best inside the range of the data.
Previous lesson: Scatter Plots and Correlation
Next course: Geometry Index
Back to the Algebra 1 Index