
Scatter Plots and Correlation
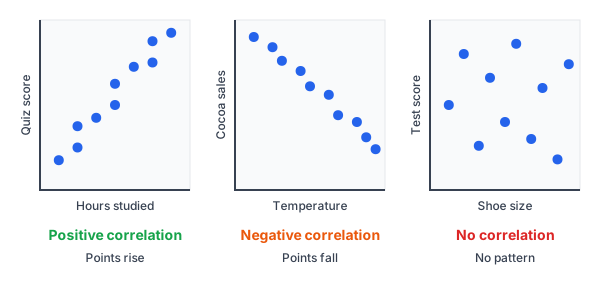
A scatter plot is a graph of paired data, with one point for each pair. Correlation describes how the two variables move together. If the points rise from left to right, the correlation is positive. If they fall, it is negative. If there is no pattern, there is no correlation.
Before this lesson: You should know slope, slope-intercept form and two-way tables.
Extra practice: The Algebra 1 Unit 10 Practice Pack has printable problems, answer keys and a cheat sheet for this unit.
What Is a Scatter Plot?
Paired data means two numbers for each person or thing. For example, a teacher records how many hours each student studied and their quiz score. Each student gives one point: (hours, score).
| Hours studied | 1 | 2 | 2 | 3 | 4 | 4 | 5 | 6 | 6 | 7 |
|---|---|---|---|---|---|---|---|---|---|---|
| Quiz score | 62 | 65 | 70 | 72 | 75 | 80 | 84 | 85 | 90 | 92 |
Put hours on the x-axis and scores on the y-axis, and plot each point. Don’t connect the dots. The shape of the cloud of points tells the story.
Types of Correlation
| Type | What the points do | Example |
|---|---|---|
| Positive | Rise from left to right | More study time, higher scores |
| Negative | Fall from left to right | Warmer days, less hot cocoa sold |
| None | Show no clear pattern | Shoe size and test score |
Correlation can also be strong or weak. In a strong correlation, the points lie close to a line. In a weak one, they are spread out but still lean one way.
The correlation coefficient, r
The correlation coefficient, r, is a number from −1 to 1 that measures how close the points are to a straight line. A calculator or app finds it for you.
| r is close to… | Meaning |
|---|---|
| 1 | Strong positive linear correlation |
| 0 | Little or no linear correlation |
| -1 | Strong negative linear correlation |
A common rule of thumb: |r| \ge 0.7 is strong, 0.3 \le |r| \lt 0.7 is moderate, and |r| \lt 0.3 is weak. The sign shows the direction. The size shows the strength.
Steps for describing a scatter plot
- Look at the direction: do the points rise, fall or neither?
- Look at the strength: are the points close to a line or spread out?
- Look at the form: is the pattern straight or curved?
- Look for outliers, points far from the rest.
Worked Examples
Example 1: Describe a scatter plot
Describe the study-time scatter plot above.
Step 1. Look at the direction. The points rise from left to right, so the correlation is positive.
Step 2. Look at the shape. The points lie close to a straight line, so the correlation is strong and linear.
Step 3. Check with the correlation coefficient. A calculator gives r \approx 0.98, which is close to 1.
Answer: A strong positive linear correlation.
Example 2: Positive, negative or none?
Decide the type of correlation for each pair.
Step 1. Temperature and hot cocoa sales: as it gets warmer, fewer people buy cocoa. One goes up while the other goes down, so it is negative.
Step 2. Height and arm span: taller people tend to have longer arms. Both go up together, so it is positive.
Step 3. Shoe size and test score: one doesn’t tell you anything about the other, so there is no correlation.
Answer: Negative, positive and none.
Example 3: Read r values
Describe each correlation: r = -0.92, r = 0.15 and r = 0.55.
|-0.92| = 0.92
Step 1. The sign gives the direction. The size, or absolute value, gives the strength. For r = -0.92, the sign is negative and the size is close to 1.
Step 2. For r = 0.15, the sign is positive, but 0.15 is close to 0.
Step 3. For r = 0.55, the sign is positive, and 0.55 is about halfway between 0 and 1.
Answer: r = -0.92 is strong negative, r = 0.15 is weak positive (close to none), and r = 0.55 is moderate positive.
Example 4: Describe data from a table
A store tracks the price of a snack (in dollars) and how many it sells each day.
| Price | 1 | 2 | 3 | 4 | 5 |
|---|---|---|---|---|---|
| Number sold | 20 | 18 | 15 | 13 | 10 |
Step 1. Look at the direction. As the price goes up by 1 dollar each time, the number sold goes down.
18 - 20 = -2,\; 15 - 18 = -3,\; 13 - 15 = -2,\; 10 - 13 = -3
Step 2. Find how much sales change each time.
Step 3. The drops are steady, close to the same size each time, so the points lie close to a line.
Step 4. Check with a calculator: r \approx -0.998, very close to -1.
Answer: A strong negative linear correlation.
Example 5: Correlation is not causation
In one town, ice cream sales and swimming accidents rise and fall together. Does ice cream cause accidents?
Step 1. The two go up together, so there is a positive correlation.
Step 2. Ask what else could make both go up. In hot weather, more people swim and more people buy ice cream.
Step 3. A hidden cause like this is called a lurking variable.
Answer: No. A correlation shows that two things are linked, but not that one causes the other.
Common Mistakes
| Mistake | Example of the error | Fix |
|---|---|---|
| Thinking correlation means cause | “More ice cream causes more accidents.” | Look for a lurking variable. Correlation only shows a link. |
| Thinking negative means weak | r = -0.9 is weaker than r = 0.5 | Compare sizes, not signs. |-0.9| \gt |0.5|, so r = -0.9 is stronger. |
| Mixing up r and slope | r = 0.98, so the line rises 0.98 per unit | r measures how close points are to a line, not how steep the line is. |
| Connecting the dots | Drawing a zigzag through every point | Leave the points alone. Look at the overall pattern. |
| Calling a curve “no correlation” | Points form a U shape, so r is near 0 | r only measures straight-line patterns. A curve can still be a strong pattern. |
Practice Problems
- Is the correlation positive, negative or none: a car’s age and its value?
- Is the correlation positive, negative or none: a person’s height and arm span?
- Is the correlation positive, negative or none: a person’s birth month and height?
- Which shows the strongest correlation: r = 0.45, r = -0.88 or r = 0.70?
- Describe a correlation with r = 0.05.
- Describe the correlation in this data: x = 1, 2, 3, 4, 5 and y = 3, 5, 6, 9, 10.
- Students who own more books tend to get higher grades. Does owning books cause higher grades? Explain.
- Match each description to an r value from -0.95, 0.10 and 0.80: (a) strong positive, (b) strong negative, (c) almost none.
- Points on a scatter plot fall from left to right and are very spread out. Describe the correlation.
- In a scatter plot, every point is close to a rising line except one point far below the rest. What is that point called?
Show answers
1.
As a car’s age goes up, its value goes down
Negative.
2.
As height goes up, arm span tends to go up too
Positive.
3.
Birth month doesn’t predict height
None.
4.
|0.45| = 0.45,\; |-0.88| = 0.88,\; |0.70| = 0.70
Compare the sizes, ignoring the signs.
The largest size is 0.88
r = -0.88 is the strongest.
5.
0.05 is very close to 0
Little or no linear correlation.
6.
Look at the direction: as x goes up, y goes up
2,\; 1,\; 3,\; 1
Find the changes in y.
The y-values rise fairly steadily, so the points are close to a line. A calculator gives r \approx 0.99
A strong positive linear correlation.
7.
This shows a correlation, not proof of cause
A lurking variable, like how much a family reads together, could affect both
Not necessarily.
8.
0.80
(a) Strong positive is close to 1.
-0.95
(b) Strong negative is close to -1.
0.10
(c) Almost none is close to 0.
9.
Falling from left to right means negative
Very spread out means weak
A weak negative correlation.
10.
A point far from the pattern of the rest is an outlier
An outlier.
Want more practice? The Algebra 1 Unit 10 Practice Pack has 37 pages of problems on this and the other lessons in the unit, with step-by-step answers and a cheat sheet.
FAQ
What does a scatter plot show?
It shows paired data as points, so you can see if two variables are related. The pattern tells you the direction and strength of the relationship.
What is the difference between correlation and causation?
Correlation means two variables move together. Causation means one actually makes the other change. A correlation alone does not prove causation.
What does the correlation coefficient r tell you?
It tells you how close the points are to a straight line, from −1 to 1. Values near 1 or −1 are strong, and values near 0 are weak. You can also describe the center and spread of each variable with mean, median, mode and range.
Summary
- A scatter plot shows paired data as points.
- Rising points mean positive correlation. Falling points mean negative correlation.
- The correlation coefficient r goes from −1 to 1. Its size shows strength.
- Strong correlations have points close to a line.
- Correlation does not prove causation. Watch for lurking variables.
Previous lesson: Two-Way Tables
Next lesson: Line of Best Fit
Back to the Algebra 1 Index