
Two-Way Tables
A two-way table shows data about two categories at once, like grade level and homework choice. Each row is one group, and each column is another. The cells inside show how many fit both. You can use the table to find percents and to see if the two categories are related.
Before this lesson: You should know percentages, converting fractions and decimals and ratios.
Extra practice: The Algebra 1 Unit 10 Practice Pack has printable problems, answer keys and a cheat sheet for this unit.
What Is a Two-Way Table?
A school asked 200 students one question: do you like online homework or paper homework? It also noted each student’s grade. A two-way table sorts all 200 answers by grade and by choice.
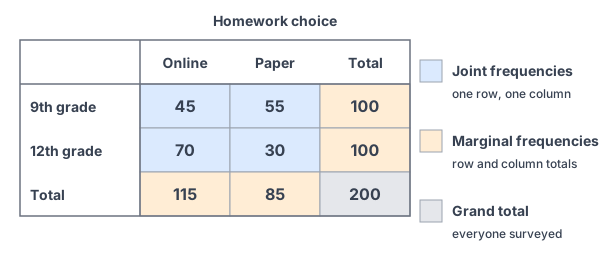
Data like this, sorted into groups, is called categorical data. A count in a cell is called a frequency.
- A joint frequency is a count inside the table. It fits one row and one column. For example, 45 ninth graders like online homework.
- A marginal frequency is a row or column total. For example, 115 students in all like online homework.
- The grand total is everyone in the survey: 200.
Relative Frequencies
A relative frequency is a count divided by a total. It turns counts into a decimal or percent. There are three kinds.
| Kind | What you divide by | Example |
|---|---|---|
| Joint relative frequency | The grand total | \frac{45}{200} = 0.225 |
| Marginal relative frequency | The grand total | \frac{115}{200} = 0.575 |
| Conditional relative frequency | A row or column total | \frac{45}{100} = 0.45 |
A conditional relative frequency looks at just one group. For example, 45 of the 100 ninth graders like online homework. That is 45% of ninth graders.
Steps for reading a two-way table
- Find the row and column that match the question.
- Decide what the whole group is. Is it everyone, or just one row or column?
- Divide the count by that group’s total.
- Write the answer as a decimal or a percent.
Worked Examples
Example 1: Fill in a two-way table
80 students said whether they like cats or dogs better. Fill in the missing numbers.
| Cat | Dog | Total | |
|---|---|---|---|
| Boys | 12 | ? | 40 |
| Girls | ? | 22 | ? |
| Total | 30 | ? | 80 |
40 - 12 = 28
Step 1. Each row and each column must add up to its total. Start with the Boys row: 40 boys in all, and 12 like cats. Subtract to find the boys who like dogs.
30 - 12 = 18
Step 2. Use the Cat column: 30 like cats in all, and 12 are boys. Subtract to find the girls who like cats.
18 + 22 = 40
Step 3. Add across the Girls row to find the girls’ total.
28 + 22 = 50
Step 4. Add down the Dog column to find the dog total.
30 + 50 = 80
Step 5. Check that the column totals add to the grand total.
40 + 40 = 80
Step 6. Check that the row totals add to the grand total too.
Answer: Boys–Dog is 28, Girls–Cat is 18, the Girls total is 40, and the Dog total is 50.
Example 2: Joint and marginal relative frequencies
Use the homework table above. Find the relative frequency of each cell by dividing its count by the grand total, 200.
\frac{45}{200} = 0.225Step 1. A cell inside the table gives a joint relative frequency. Divide the ninth graders who chose online, 45, by 200 (see converting fractions and decimals).
\frac{55}{200} = 0.275,\; \frac{70}{200} = 0.35,\; \frac{30}{200} = 0.15Step 2. Do the same for the other three inside cells.
\frac{100}{200} = 0.5,\; \frac{100}{200} = 0.5Step 3. A total in the margin gives a marginal relative frequency. Divide each row total by 200.
\frac{115}{200} = 0.575,\; \frac{85}{200} = 0.425Step 4. Divide each column total by 200.
Step 5. Put the results in a table. The grand total becomes 1.
| Online | Paper | Total | |
|---|---|---|---|
| 9th grade | 0.225 | 0.275 | 0.5 |
| 12th grade | 0.35 | 0.15 | 0.5 |
| Total | 0.575 | 0.425 | 1 |
0.225 \cdot 100 = 22.5,\; 0.575 \cdot 100 = 57.5
Step 6. Change decimals to percents by multiplying by 100 (see percentages).
Answer: 22.5% of all students are ninth graders who like online homework, and 57.5% of all students like online homework.
Example 3: Conditional relative frequencies by row
What percent of each grade likes online homework?
Step 1. The question is about each grade, so the whole group is one row. Divide by the row total, not the grand total.
\frac{45}{100} = 0.45 = 45\%Step 2. Ninth graders: 45 of the 100 chose online.
\frac{70}{100} = 0.70 = 70\%Step 3. Twelfth graders: 70 of the 100 chose online.
Answer: 45% of ninth graders and 70% of twelfth graders like online homework.
Example 4: Is there an association?
Is there an association between grade and homework choice?
Step 1. Two categories have an association if the row percents are very different from group to group. Use the percents from Example 3: 45% and 70%.
70 - 45 = 25
Step 2. Find how far apart they are.
Step 3. A gap of 25 percentage points is large, so the percents are far apart.
Answer: Yes. There is an association between grade and homework choice. Twelfth graders are more likely to choose online homework.
Example 5: Conditional relative frequency by column
Of the students who like paper homework, what percent are ninth graders?
Step 1. Now the whole group is the Paper column. Its total is 85 students.
\frac{55}{85} \approx 0.647Step 2. 55 of those 85 students are ninth graders. Divide, and round to the nearest thousandth.
0.647 \cdot 100 = 64.7
Step 3. Multiply by 100 to write it as a percent.
Answer: About 64.7% of the students who like paper homework are ninth graders.
Common Mistakes
| Mistake | Example of the error | Fix |
|---|---|---|
| Dividing by the wrong total | “What percent of 9th graders like online?” \frac{45}{200} | The group is 9th graders, so use their total: \frac{45}{100} = 45\%. |
| Mixing up row and column percents | Saying 55 out of 85 means 55% of 9th graders like paper | \frac{55}{85} is the percent of paper fans who are 9th graders. Of 9th graders, \frac{55}{100} = 55\% like paper. |
| Comparing counts, not percents | Groups of 90 and 60 people, so comparing 40 to 45 | Change each count to a percent of its own group first. |
| Totals that don’t add up | Row totals of 40 and 40, but a grand total of 90 | Each row, each column and the grand total must add up. |
| Thinking association means cause | “Being in 12th grade makes students like online homework.” | An association only shows a link. It doesn’t prove one thing causes the other. |
Practice Problems
Problems 1 to 8 use this table. A theater asked 150 people if they bought popcorn.
| Popcorn | No popcorn | Total | |
|---|---|---|---|
| Adults | 40 | 50 | 90 |
| Kids | 45 | 15 | 60 |
| Total | 85 | 65 | 150 |
- How many kids bought popcorn?
- How many people in all bought popcorn?
- What is the joint relative frequency of adults who bought popcorn?
- What is the marginal relative frequency of kids?
- What percent of adults bought popcorn?
- What percent of kids bought popcorn?
- Is there an association between age group and buying popcorn? Explain.
- Of the people who bought popcorn, what percent were kids?
- Fill in the table. Juniors: 30 said Yes, 50 in all. Seniors: 20 said No. In all, 70 said Yes, and 110 people were asked.
- In Group A, 30 said Yes and 20 said No. In Group B, 60 said Yes and 40 said No. Is there an association?
Show answers
1.
Read the cell in the Kids row and Popcorn column
45 kids bought popcorn.
2.
40 + 45 = 85
Add down the Popcorn column.
85 people. This is the marginal frequency for the Popcorn column.
3.
\frac{40}{150} \approx 0.267Divide the adults who bought popcorn by the grand total, and round.
0.267 \cdot 100 = 26.7
Multiply by 100.
About 26.7%.
4.
\frac{60}{150} = 0.4Divide the Kids total by the grand total.
0.4 \cdot 100 = 40
Multiply by 100.
40%.
5.
\frac{40}{90} \approx 0.444The group is adults, so divide by the Adults row total, 90.
0.444 \cdot 100 = 44.4
Multiply by 100.
About 44.4%.
6.
\frac{45}{60} = 0.75The group is kids, so divide by the Kids row total, 60.
0.75 \cdot 100 = 75
Multiply by 100.
75%.
7.
Compare the row percents from problems 5 and 6: 75% of kids and about 44.4% of adults
75 - 44.4 = 30.6
Find the gap.
The percents are far apart
Yes, there is an association. Kids were more likely to buy popcorn.
8.
\frac{45}{85} \approx 0.529The group is the Popcorn column, with 85 people. Divide the kids in it by 85.
0.529 \cdot 100 = 52.9
Multiply by 100.
About 52.9%.
9.
50 - 30 = 20
Juniors who said No: subtract from the Juniors total.
70 - 30 = 40
Seniors who said Yes: subtract from the Yes total.
40 + 20 = 60
Seniors total: add across the row.
20 + 20 = 40
No total: add down the column.
Check the row totals: 50 + 60 = 110
Check the column totals: 70 + 40 = 110
10.
30 + 20 = 50,\; 60 + 40 = 100
Find each group’s total.
\frac{30}{50} = 0.6 = 60\%Group A’s Yes percent.
\frac{60}{100} = 0.6 = 60\%Group B’s Yes percent.
The percents are the same
No, there is no association.
Want more practice? The Algebra 1 Unit 10 Practice Pack has 37 pages of problems on this and the other lessons in the unit, with step-by-step answers and a cheat sheet.
FAQ
What is a two-way table?
It is a table that sorts data by two categories at once. Rows show one category and columns show the other.
What is the difference between joint and marginal frequency?
A joint frequency is a count inside the table, for one row and one column. A marginal frequency is a total, found in the last row or column.
How do you find a conditional relative frequency?
Divide a count by its row total or its column total, not the grand total. It answers questions like “What percent of this group…?” It is closely tied to probability.
How can you tell if there is an association in a two-way table?
Find the conditional percents for each group. If they are very different, there is an association. If they are about the same, there isn’t.
Summary
- A two-way table sorts categorical data by two categories.
- Joint frequencies are inside cells. Marginal frequencies are totals.
- A relative frequency is a count divided by a total.
- For conditional relative frequencies, divide by a row or column total.
- Very different percents between groups show an association, not a cause.
Previous lesson: Linear, Quadratic and Exponential Models
Next lesson: Scatter Plots and Correlation
Back to the Algebra 1 Index