
Key Features of Functions
The key features of a function are facts you can read from its graph. They include where it crosses the axes (the intercepts), its highest or lowest point (maximum or minimum), where it goes up or down (increasing or decreasing), and where it is above or below the x-axis (positive or negative).
Before this lesson: You should know function notation and how to find domain and range.
Extra practice: The Algebra 1 Unit 3 Practice Pack has printable problems, answer keys and a cheat sheet for this unit.
What Are the Key Features of a Function?
Think of a graph as a hiking trail seen from the side. You walk it from left to right. Some parts climb, some parts drop, and there may be a lowest valley or a highest peak. The key features describe that trip.
| Feature | What it means | How to find it |
|---|---|---|
| x-intercept (zero) | Where the graph crosses the x-axis | Set f(x) = 0, or read where y = 0 |
| y-intercept | Where the graph crosses the y-axis | Find f(0) |
| Maximum | The highest point | The top of a peak |
| Minimum | The lowest point | The bottom of a valley |
| Increasing | The graph goes up as you move right | The x-values where it climbs |
| Decreasing | The graph goes down as you move right | The x-values where it falls |
| Positive | The graph is above the x-axis | The x-values where f(x) \gt 0 |
| Negative | The graph is below the x-axis | The x-values where f(x) \lt 0 |
How to Find the Key Features of a Function
- Intercepts: find f(0) for the y-intercept. Solve f(x) = 0 for each x-intercept, or read them from the graph.
- Maximum or minimum: find the highest or lowest point. Give it as a point, like (1, −4).
- Increasing or decreasing: move left to right. Write the x-values where the graph climbs or falls.
- Positive or negative: write the x-values where the graph is above or below the x-axis.
Intervals are always written with x-values, using inequality signs. For example, “decreasing for x \lt 1” means the graph falls everywhere to the left of x = 1.
Key Features of Functions Examples
Example 1: A line
Find the intercepts of f(x) = -2x + 4. Is it increasing or decreasing? Where is it positive?
f(0) = -2(0) + 4 = 0 + 4 = 4
Step 1. Find the y-intercept. Substitute x = 0.
-2x + 4 = 0
Step 2. Find the x-intercept. Set the output equal to 0. Then solve it like the equations in two-step equations.
-2x = -4
Step 3. Subtract 4 from both sides.
x = 2
Step 4. Divide both sides by -2.
Step 5. Decide increasing or decreasing. The number in front of x is -2, so each step right takes the line down 2. It falls from left to right.
Step 6. Find where it is positive. The line is above the x-axis to the left of the x-intercept, x = 2.
Answer: The intercepts are (0, 4) and (2, 0). It is decreasing everywhere. It is positive for x \lt 2.
Example 2: Intercepts and minimum from a graph
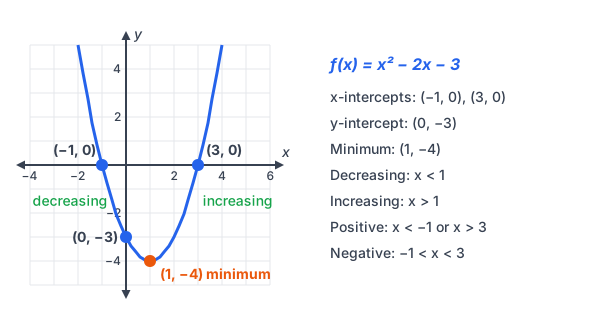
Use the graph of f(x) = x^2 - 2x - 3 above. Find the intercepts and the minimum.
Step 1. Read the x-intercepts. The graph crosses the x-axis at x = -1 and x = 3.
f(-1) = (-1)^2 - 2(-1) - 3 = 1 + 2 - 3 = 0
Step 2. Check x = -1 in the rule. Use the order of operations: square, then multiply, then add and subtract.
f(3) = 3^2 - 2(3) - 3 = 9 - 6 - 3 = 0
Step 3. Check x = 3.
f(0) = 0^2 - 2(0) - 3 = -3
Step 4. Find the y-intercept. Substitute x = 0.
f(1) = 1^2 - 2(1) - 3 = 1 - 2 - 3 = -4
Step 5. Read the lowest point from the graph: (1, -4). Check it.
Answer: x-intercepts (-1, 0) and (3, 0). y-intercept (0, -3). Minimum (1, -4), so the minimum value is -4.
Example 3: Increasing, decreasing, positive and negative
For the same function, f(x) = x^2 - 2x - 3, find where it increases, decreases, and is positive or negative.
x \lt 1
Step 1. Move along the graph from left to right. It falls until the minimum at x = 1, so it is decreasing here.
x \gt 1
Step 2. After the minimum, it climbs, so it is increasing here.
x \lt -1 \text{ or } x \gt 3Step 3. Find where it is positive. The graph is above the x-axis to the left of -1 and to the right of 3.
-1 \lt x \lt 3
Step 4. Find where it is negative. The graph is below the x-axis between the x-intercepts.
Answer: Decreasing for x \lt 1. Increasing for x \gt 1. Positive for x \lt -1 or x \gt 3. Negative for -1 \lt x \lt 3.
Example 4: Features from a table
Here is a table for a function k(x). Find the intercepts and the maximum.
| x | -3 | -2 | -1 | 0 | 1 | 2 |
|---|---|---|---|---|---|---|
| k(x) | -5 | 0 | 3 | 4 | 3 | 0 |
x = -2 \text{ and } x = 2Step 1. Find the x-intercepts. Look for outputs of 0.
(0, 4)
Step 2. Find the y-intercept. Look at the input 0. Its output is 4.
Step 3. Find the maximum. The outputs rise to 4 and then fall again, with the same pattern on each side. So the highest point is (0, 4).
Answer: x-intercepts (-2, 0) and (2, 0). y-intercept and maximum (0, 4).
Example 5: Word problem
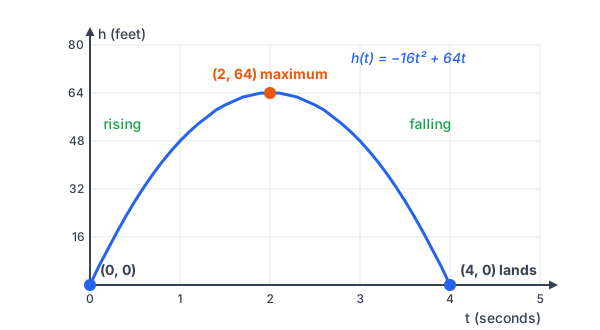
A ball is kicked straight up from the ground. Its height after t seconds is h(t) = -16t^2 + 64t feet. Find the maximum height and when the ball lands.
h(2) = -16(2)^2 + 64(2)
Step 1. Read the highest point on the graph: (2, 64). Check it by substituting t = 2.
h(2) = -16(4) + 64(2)
Step 2. Square 2.
h(2) = -64 + 128
Step 3. Multiply. A negative times a positive is negative. (See multiplying and dividing integers.)
h(2) = 64
Step 4. Add.
h(4) = -16(4)^2 + 64(4) = -16(16) + 64(4)
Step 5. Find when it lands. The height is 0 again at the second t-intercept, t = 4. Check it.
h(4) = -256 + 256 = 0
Step 6. Multiply, then add.
Answer: The maximum height is 64 feet, 2 seconds after the kick. The ball lands after 4 seconds. It is increasing for 0 \lt t \lt 2 and decreasing for 2 \lt t \lt 4.
Common Mistakes
| Mistake | Example of the error | Fix |
|---|---|---|
| Giving intervals with y-values | Writing “decreasing for y \lt -4” | Intervals use x-values: decreasing for x \lt 1. |
| Mixing up the two intercepts | Writing the x-intercept 2 as (0, 2) | An x-intercept has y = 0: (2, 0). |
| Reading the graph right to left | Calling the left side of a U increasing | Always move left to right, the way you read. |
| Confusing positive with increasing | Saying a graph is positive because it goes up | Positive means above the x-axis. Increasing means going up. |
| Giving the minimum as only an x-value | Saying the minimum is 1 | The minimum point is (1, -4). The minimum value is -4. |
Other Features: Symmetry and End Behavior
Some graphs have a line of symmetry. If you fold the graph along it, the two sides match. The U-shape in this lesson folds along the line x = 1, right through its minimum.
End behavior tells what the graph does far to the left and far to the right. Both arms of f(x) = x^2 - 2x - 3 go up forever. A line with a negative slope, like f(x) = -2x + 4, goes up on the left and down on the right.
You will use these features again with lines in x-intercepts and y-intercepts and slope.
Practice Problems
- Find the x– and y-intercepts of f(x) = 3x - 6.
- Is f(x) = 3x - 6 increasing or decreasing? Where is it positive?
- Find the y-intercept of g(x) = x^2 - 6x + 5.
- Show that (1, 0) and (5, 0) are x-intercepts of g(x).
- The lowest point of g(x) is at x = 3. Find the minimum point.
- Where is g(x) decreasing? Where is it increasing?
- Where is g(x) negative?
- A table for k(x) has x: -1, 0, 1, 2, 3, 4 and k(x): -5, 0, 3, 4, 3, 0. Find the x-intercepts and the maximum.
- Describe the key features of the horizontal line y = 5.
- A toy rocket’s height is d(t) = -4t^2 + 32t feet after t seconds. Its highest point is at t = 4. Find the maximum height and when it lands.
Show answers
1.
f(0) = 3(0) - 6 = -6
Find the y-intercept by substituting 0.
3x - 6 = 0
Find the x-intercept by setting the output to 0.
3x = 6
Add 6 to both sides.
x = 2
Divide both sides by 3.
The intercepts are (0, -6) and (2, 0).
2.
The number in front of x is 3, which is positive, so the line rises. It is increasing
3x - 6 \gt 0
Find where it is positive by setting the output above 0.
3x \gt 6
Add 6 to both sides.
x \gt 2
Divide both sides by 3.
3.
g(0) = 0^2 - 6(0) + 5
Substitute 0.
g(0) = 0 - 0 + 5 = 5
Simplify.
The y-intercept is (0, 5).
4.
g(1) = 1^2 - 6(1) + 5 = 1 - 6 + 5 = 0
Substitute 1.
g(5) = 5^2 - 6(5) + 5 = 25 - 30 + 5 = 0
Substitute 5.
Both outputs are 0, so both points are x-intercepts.
5.
g(3) = 3^2 - 6(3) + 5
Substitute 3.
g(3) = 9 - 18 + 5
Square and multiply.
g(3) = -4
Add and subtract.
The minimum point is (3, -4).
6.
The graph falls until the lowest point at x = 3
Then it rises
Decreasing for x \lt 3. Increasing for x \gt 3.
7.
The x-intercepts are 1 and 5
The U-shape dips below the x-axis between them, down to −4 at x = 3
Negative for 1 \lt x \lt 5.
8.
Find the outputs of 0. They are at x = 0 and x = 4
Find the largest output. It is 4, at x = 2
x-intercepts (0, 0) and (4, 0). Maximum (2, 4).
9.
Every output is 5, so the line never reaches 0. It has no x-intercept
At x = 0 the output is 5, so the y-intercept is (0, 5)
The output never changes, so it is neither increasing nor decreasing
It is positive everywhere.
10.
d(4) = -4(4)^2 + 32(4)
Substitute 4.
d(4) = -4(16) + 32(4)
Square 4.
d(4) = -64 + 128
Multiply.
d(4) = 64
Add.
d(8) = -4(64) + 32(8) = -256 + 256 = 0
The graph is symmetric about t = 4, and it starts at height 0 when t = 0. So it lands 4 seconds after the top, at t = 8. Check.
The maximum height is 64 feet. The rocket lands after 8 seconds.
Want more practice? The Algebra 1 Unit 3 Practice Pack has 39 pages of problems on this and the other lessons in the unit, with step-by-step answers and a cheat sheet.
Key Features of Functions FAQ
What are the key features of a function?
They are the intercepts, the maximum or minimum, where the function increases or decreases, where it is positive or negative, and its end behavior and symmetry.
How do you find the x-intercept of a function?
Set f(x) = 0 and solve for x. On a graph, read where it crosses the x-axis.
What is the difference between increasing and positive?
Increasing means the graph goes up as you move right. Positive means the graph is above the x-axis. A graph can be going up while it is still below the axis.
What is a maximum of a function?
The maximum is the highest point on the graph. Its y-value is the largest output, called the maximum value.
Summary
- x-intercepts: where f(x) = 0. y-intercept: f(0).
- Maximum and minimum: the highest and lowest points.
- Increasing or decreasing: read the graph from left to right.
- Positive or negative: above or below the x-axis.
- Write every interval with x-values and inequality signs.
Previous lesson: Domain and Range
Next lesson: Two-Variable Linear Equations
Back to the Algebra 1 Index