
Rates of Change of Functions
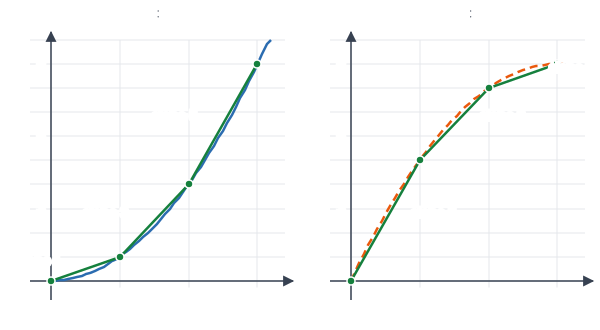
The rate of change of a function tells how fast its output changes as the input changes. Over an interval [a, b], the average rate of change is \frac{f(b) - f(a)}{b - a}. Comparing these rates on back-to-back intervals shows the shape of the graph: rates that increase make it bend up (concave up), and rates that decrease make it bend down (concave down).
Before this lesson: You should know Average Rate of Change, the Difference Quotient and Linear, Quadratic and Exponential Models.
What Changing Rates Tell You
A single average rate of change is the slope of one secant line. It tells you whether a function went up or down over an interval, and how fast on average.
The real story is in how the rates change. Picture a car whose speed keeps rising: its distance graph gets steeper and bends upward. Now picture a car that keeps slowing down but still moves forward: its distance graph rises but flattens out, bending downward.
So a function can increase in two ways. It can increase at an increasing rate, which makes it concave up, or at a decreasing rate, which makes it concave down. A point where the rate switches from increasing to decreasing, or the reverse, is a point of inflection.
Rules for Rates of Change
\text{average rate of change on } [a, b] = \frac{f(b) - f(a)}{b - a}| Rates on equal back-to-back intervals | What the graph does |
|---|---|
| All the same | A straight line (linear function) |
| Increasing | Bends up: concave up |
| Decreasing | Bends down: concave down |
| Switch from increasing to decreasing, or back | A point of inflection between them |
The pattern of the rates also identifies the function family, using equal steps in x:
- Linear: the rates of change are constant.
- Quadratic: the rates change by the same amount each step (constant second differences).
- Exponential: the rates change by the same factor each step, just like the outputs.
Worked Examples
Example 1: Compare two intervals
For f(x) = x^2 - 4x + 1, find the average rate of change on [0, 2] and on [2, 4]. What do the rates say about the graph?
Find the outputs: f(0) = 1, f(2) = 4 - 8 + 1 = -3, f(4) = 16 - 16 + 1 = 1
\frac{f(2) - f(0)}{2 - 0} = \frac{-3 - 1}{2} = \frac{-4}{2} = -2Rate on [0, 2].
\frac{f(4) - f(2)}{4 - 2} = \frac{1 - (-3)}{2} = \frac{4}{2} = 2Rate on [2, 4].
Compare: the rate went from −2 up to 2, so the rates are increasing
Answer: −2 and 2. The function decreases and then increases, and since its rates increase, the graph is concave up, like every upward parabola.
Example 2: Rates from a table
Use the table to describe how f is changing.
| x | 0 | 1 | 2 | 3 | 4 |
|---|---|---|---|---|---|
| f(x) | 5 | 9 | 12 | 14 | 15 |
9 - 5 = 4
Find the rate on each interval of length 1. Start with [0, 1].
12 - 9 = 3
Find the rate on [1, 2].
14 - 12 = 2
Find the rate on [2, 3].
15 - 14 = 1
Find the rate on [3, 4].
All the rates are positive, so f is increasing.
The rates go 4, 3, 2, 1, so they are decreasing.
Answer: f is increasing at a decreasing rate, so its graph is concave down on [0, 4]. The rates drop by exactly 1 each step, which points to a quadratic.
Example 3: Identify the function family
Decide whether each table fits a linear, quadratic or exponential function.
| x | 0 | 1 | 2 | 3 | 4 |
|---|---|---|---|---|---|
| g(x) | 3 | 6 | 12 | 24 | 48 |
| h(x) | 1 | 4 | 9 | 16 | 25 |
6 - 3 = 3
Find the rates for g. Start with the first interval.
12 - 6 = 6
Find the next rate.
24 - 12 = 12
Find the next rate.
48 - 24 = 24
Find the last rate.
Each rate is 2 times the one before, so g is exponential (it doubles).
4 - 1 = 3
Find the rates for h. Start with the first interval.
9 - 4 = 5
Find the next rate.
16 - 9 = 7
Find the next rate.
25 - 16 = 9
Find the last rate.
5 - 3 = 2
Find the change in the rates for h.
7 - 5 = 2
Find the next change.
9 - 7 = 2
Find the last change. It is constant, so h is quadratic.
Answer: g is exponential and h is quadratic. Both are concave up, because their rates increase.
Example 4: Find where the bending changes
For f(x) = x^3 - 6x^2, find the rates of change on [0, 1], [1, 2], [2, 3] and [3, 4]. Where does the concavity seem to change?
f(0) = 0
Find the outputs. Substitute 0.
f(1) = 1 - 6 = -5
Substitute 1.
f(2) = 8 - 24 = -16
Substitute 2.
f(3) = 27 - 54 = -27
Substitute 3.
f(4) = 64 - 96 = -32
Substitute 4.
-5 - 0 = -5
Find the rate on [0, 1].
-16 - (-5) = -11
Find the rate on [1, 2].
-27 - (-16) = -11
Find the rate on [2, 3].
-32 - (-27) = -5
Find the rate on [3, 4].
From the first to the second interval, the rate drops from −5 to −11: concave down.
From the third to the fourth interval, the rate rises from −11 to −5: concave up.
Answer: The rates switch from decreasing to increasing around x = 2, so the graph changes from concave down to concave up there. The point (2, -16) is a point of inflection.
Example 5: Word problem with an accelerating car
A car starts from rest. The table shows its distance d, in meters, after t seconds. Describe its speed.
| t (s) | 0 | 2 | 4 | 6 | 8 |
|---|---|---|---|---|---|
| d (m) | 0 | 10 | 30 | 60 | 100 |
\frac{10 - 0}{2} = 5Rate on [0, 2] (m/s).
\frac{30 - 10}{2} = 10Rate on [2, 4] (m/s).
\frac{60 - 30}{2} = 15Rate on [4, 6] (m/s).
\frac{100 - 60}{2} = 20Rate on [6, 8] (m/s).
\frac{5}{2} = 2.5The average speed rises by 5 m/s every 2 seconds (m/s each second).
Answer: The car is speeding up, so the distance graph is concave up. Its average speed grows by about 2.5 meters per second every second.
Common Mistakes
| Mistake | Example of the error | Fix |
|---|---|---|
| Mixing up the order | \frac{f(0) - f(2)}{2 - 0} | Keep the same order on top and bottom: \frac{f(2) - f(0)}{2 - 0}. |
| Thinking increasing means concave up | 5, 9, 12, 14, 15 rises, so it bends up | Look at the rates, 4, 3, 2, 1. They shrink, so it bends down. |
| Comparing unequal intervals | Comparing the rate on [0, 1] with the rate on [1, 5] to find a family | Use equal steps in x when checking differences or ratios. |
| Forgetting negative rates | Rates -5 and -11 called increasing | −11 is less than −5, so the rate decreased. |
| Dividing by the wrong width | Using a width of 1 when t steps by 2 | Divide by b - a, the actual width of the interval. |
Related Methods
Second differences
Subtracting one rate from the next gives the second differences. Constant second differences mean a quadratic, the same test used for choosing a model.
Instantaneous rate of change
Shrinking the interval toward a single point turns the average rate into the instantaneous rate, the slope of the tangent line. The difference quotient is the tool for that, and it leads to the derivative in calculus.
Rates in context
Always give units: output units per input unit. For example, meters per second for distance and time, or people per year for population.
Practice Problems
- Find the average rate of change of f(x) = 3x - 7 on [1, 5].
- Find the average rate of change of f(x) = x^2 on [1, 3].
- Find the average rate of change of f(x) = 2^x on [0, 3].
- For f(x) = \sqrt{x}, find the rates on [1, 4] and [4, 9]. Is the graph concave up or down?
- A table has x = 0, 1, 2, 3, 4 and f(x) = 2, 7, 14, 23, 34. Which family fits, and which way does it bend?
- A table has x = 0, 1, 2, 3, 4 and f(x) = 80, 40, 20, 10, 5. Describe the rates and the concavity.
- For f(x) = -x^2 + 6x, find the rates on [0, 1], [1, 2] and [2, 3], and describe how f is increasing.
- For f(x) = \frac{1}{x}, find the rates on [1, 2] and [2, 3]. Is the graph concave up or down there?
- Compare f(x) = 4x and g(x) = 2^x on [0, 4] and on [3, 4]. Which grows faster on each?
- A town had 1,200 people in year 0, 1,500 in year 5, 1,750 in year 10 and 1,950 in year 15. Describe how the population is growing.
Show answers
1.
f(5) = 15 - 7 = 8 and f(1) = 3 - 7 = -4
\frac{8 - (-4)}{5 - 1} = \frac{12}{4} = 3Find the average rate of change: change in y over change in x.
Answer: 3, the slope of the line
2.
f(3) = 9 and f(1) = 1
\frac{9 - 1}{3 - 1} = \frac{8}{2} = 4Find the average rate of change: change in y over change in x.
Answer: 4
3.
f(3) = 2^3 = 8 and f(0) = 2^0 = 1
\frac{8 - 1}{3 - 0} = \frac{7}{3}Find the average rate of change: change in y over change in x.
Answer: \frac{7}{3} \approx 2.33
4.
\frac{\sqrt{4} - \sqrt{1}}{4 - 1} = \frac{2 - 1}{3} = \frac{1}{3}Rate on [1, 4].
\frac{\sqrt{9} - \sqrt{4}}{9 - 4} = \frac{3 - 2}{5} = \frac{1}{5}Rate on [4, 9].
The rate dropped from \frac{1}{3} to \frac{1}{5}
Answer: increasing at a decreasing rate, so concave down
5.
5, 7, 9, 11
List the rates.
2, 2, 2
Find the second differences. They are constant.
Answer: quadratic, concave up (rates increase)
6.
-40, -20, -10, -5
List the rates.
Each rate is half the one before, and the rates are increasing toward 0
Answer: exponential decay; decreasing at a slower and slower rate, so concave up
7.
f(0) = 0, f(1) = 5, f(2) = 8, f(3) = 9
Rates: 5 - 0 = 5, 8 - 5 = 3, 9 - 8 = 1
Answer: increasing at a decreasing rate, so concave down
8.
\frac{\frac{1}{2} - 1}{1} = -\frac{1}{2}Rate on [1, 2].
\frac{\frac{1}{3} - \frac{1}{2}}{1} = -\frac{1}{6}Rate on [2, 3].
-\frac{1}{6} is greater than -\frac{1}{2}, so the rates increase
Answer: concave up
9.
On [0, 4]: f has rate \frac{16 - 0}{4} = 4, and g has rate \frac{16 - 1}{4} = \frac{15}{4} = 3.75
On [3, 4]: f has rate 16 - 12 = 4, and g has rate 16 - 8 = 8
Answer: f grows faster on average over [0, 4], but g grows faster on [3, 4], and exponential growth keeps pulling ahead
10.
Rates: \frac{1500 - 1200}{5} = 60, \frac{1750 - 1500}{5} = 50, \frac{1950 - 1750}{5} = 40 people per year
The rates are positive but decreasing
Answer: growing at a decreasing rate (concave down), losing about 10 people per year of growth every 5 years
FAQ
How do you find the rate of change of a function?
Over an interval [a, b], divide the change in output by the change in input: \frac{f(b) - f(a)}{b - a}. This average rate is the slope of the secant line.
What does concave up mean?
The graph bends upward, like a cup. Its rates of change increase from left to right, so its secant slopes keep getting bigger.
Can a function be increasing and concave down?
Yes. It rises, but more and more slowly, like a population that keeps growing but adds fewer people each year.
How do rates of change show a quadratic function?
With equal steps in x, the rates of change of a quadratic change by the same amount each time. Its second differences are constant.
Summary
- Average rate of change on [a, b]: \frac{f(b) - f(a)}{b - a}, the slope of a secant line.
- Increasing rates mean concave up; decreasing rates mean concave down.
- A switch in the pattern marks a point of inflection.
- Constant rates: linear. Constant second differences: quadratic. Constant ratio: exponential.
- Always compare equal intervals and give units.
Previous lesson: Difference Quotient
Next lesson: Descartes’ Rule of Signs
Back to the Precalculus Index