
Sampling Bias
Sampling bias happens when the way a sample is collected makes it differ from the population in the same direction again and again. The main types are undercoverage, nonresponse, response bias, voluntary response and convenience sampling. A biased sample gives misleading results, and a larger sample does not fix it.
Before this lesson: Sampling Methods, Percentages and Mean, Median, Mode and Range
What bias means
A sample statistic, like a sample percent, almost never equals the population value exactly. Random samples miss a little high or a little low, by chance. That chance error is called sampling variability, and it shrinks as samples get bigger.
Bias is different. A biased method misses in the same direction every time, like a scale that always reads 5 pounds heavy. Taking a bigger sample with the same method just gives you a more confident wrong answer.
Types of sampling bias
| Type | What goes wrong | Example |
|---|---|---|
| Voluntary response | People choose themselves. Those with strong opinions, often negative ones, respond most. | An online poll on a news site |
| Convenience sample | The sample is whoever is easy to reach. | Surveying students at the gym about exercise |
| Undercoverage | Some groups are left out of the list (the sampling frame) used to choose the sample. | A phone survey that only calls landlines |
| Nonresponse | People who were chosen can’t be reached or refuse to answer. | Only 23% of mailed surveys come back |
| Response bias | People give answers that are not true, often because of the question’s wording or who is asking. | “Don’t you agree that recess is too short?” |
The first two are problems with how the sample is chosen. Undercoverage and nonresponse are about who ends up in it. Response bias is about whether the answers are honest.
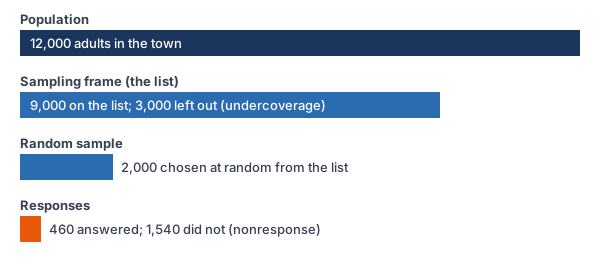
The bars come from Examples 2 and 3 below. Even with a random sample, the final 460 answers may not look like the town.
Sampling bias examples
Example 1: Voluntary response
A radio host asks listeners to call in about a new skate park. Of the 1,000 people who call, 840 oppose it. The host says, “84% of the city opposes the skate park.” Is that a fair claim?
\dfrac{840}{1000} = 0.84Find the fraction of callers who oppose it.
0.84 = 84\%
Change to a percent (see percentages).
\text{callers chose themselves}Name the method: a voluntary response sample.
Answer: no. 84% describes the callers, not the city. People who feel strongly, especially those who are upset, are the most likely to call. The true percent who oppose could be much lower.
Example 2: Undercoverage
A town has 12,000 adults. A survey picks people at random from a list of 9,000 adults who have landline phones. What percent of adults can never be chosen, and why does it matter?
12000 - 9000 = 3000
Find how many adults are not on the list.
\dfrac{3000}{12000} = 0.25Divide by the population size.
0.25 = 25\%
Change to a percent.
Answer: 25% of adults have no chance to be chosen. Younger adults are less likely to have landlines, so the survey undercovers them. Its results will lean toward the views of older adults.
Example 3: Nonresponse
The town mails surveys to an SRS of 2,000 adults from the list. Only 460 send them back. Find the response rate and the nonresponse rate.
\dfrac{460}{2000} = 0.23Divide the responses by the number chosen.
0.23 = 23\%
Change to a percent: the response rate.
100\% - 23\% = 77\%
Subtract to find the nonresponse rate.
Answer: the response rate is 23%, so 77% of the people chosen did not respond. The sample was random, but the people who answer may be busier, less busy or more interested in the topic than those who don’t.
Example 4: Response bias from wording
A school asks two random groups of 200 students about a later start time (example data). Version A: “Should school start later so students can get more sleep?” 146 say yes. Version B: “Should school start later, even if it means ending later and less time for jobs and sports?” 82 say yes. Compare the results.
\dfrac{146}{200} = 0.73 = 73\%Find the percent who say yes to version A.
\dfrac{82}{200} = 0.41 = 41\%Find the percent who say yes to version B.
73\% - 41\% = 32\%
Subtract to compare.
Answer: the wording changed the result by 32 percentage points. Each version pushes students toward one answer, which is response bias. A fair question gives both sides, or neither.
Example 5: Measuring bias (word problem)
A school’s records show that its students exercise a mean of 3.0 hours per week. A reporter surveys 50 students in the gym after school and finds a mean of 4.5 hours. Name the bias and find how far off the estimate is.
\text{students in the gym}Name the method: a convenience sample.
4.5 - 3.0 = 1.5
Subtract the true mean from the sample mean.
\dfrac{1.5}{3.0} = 0.5 = 50\%Compare the error with the true mean.
Answer: the convenience sample overestimates by 1.5 hours, or 50%. Students who are in the gym exercise more than most students. Surveying 500 gym students instead of 50 would not fix this.
Common mistakes
| Mistake | Example of the error | Fix |
|---|---|---|
| Thinking a big sample removes bias | “The online poll had 50,000 votes, so it must be right.” | Size only reduces chance error. A biased method stays biased. |
| Mixing up nonresponse and undercoverage | Calling people with no landline “nonresponse” | Undercoverage: never on the list. Nonresponse: chosen, but didn’t answer. |
| Mixing up nonresponse and response bias | Calling a refusal “response bias” | Response bias means the answers given are untrue. Nonresponse means no answer. |
| Calling every sampling error bias | Saying a random sample is biased because it got 48% instead of 50% | Small random misses are sampling variability. Bias is a miss in one direction, again and again. |
| Not giving a direction | “The gym survey is biased.” | Say which way: the gym survey likely overestimates exercise time. |
Related methods
How to reduce bias
- Use a random sampling method instead of a voluntary response or convenience sample.
- Use a sampling frame that includes the whole population.
- Follow up with people who don’t respond, and keep surveys short.
- Ask neutral questions, and let people answer in private when the topic is sensitive.
Bias in experiments
Surveys collect information without changing anything. The next lesson, Observational Studies and Experiments, shows when you can claim that one thing causes another.
Practice problems
- A news website posts a poll, and 5,200 visitors vote. What type of bias is likely?
- To learn about homework time at a school, a student surveys only students in AP classes. What type of bias is this, and will the estimate likely be too high or too low?
- A survey asks, “Don’t you agree that the town needs a new library?” What type of bias is this?
- A company mails 1,500 surveys and gets 420 back. Find the response rate.
- A town has 8,000 adults, and the list used for a survey has 7,200 of them. What percent of adults are left out?
- In a call-in poll, 312 of 400 callers say yes. Find the sample percent. Is it a good estimate for the whole population?
- A survey’s sample mean is 4.5 hours, but the true population mean is 3.0 hours. By how much does the sample overestimate?
- A teacher asks each student, face to face, whether they have ever cheated on a test. What type of bias is likely, and in which direction?
- A poll has a biased method. Will doubling the sample size fix the bias? Explain.
- Only 23% of the people chosen for a mailed survey respond. Name one way to reduce this problem.
Show answers
1.
\text{visitors chose to vote}People pick themselves.
Answer: voluntary response bias
2.
\text{only AP students}Students outside AP classes have no chance to be chosen.
Answer: undercoverage (also a convenience sample); the estimate is likely too high, because AP students tend to have more homework
3.
\text{leading question}The wording pushes people to agree.
Answer: response bias from question wording
4.
\dfrac{420}{1500} = 0.28Divide responses by surveys sent.
0.28 = 28\%
Change to a percent.
Answer: 28%
5.
8000 - 7200 = 800
Find how many are left out.
\dfrac{800}{8000} = 0.1Divide by the population size.
0.1 = 10\%
Change to a percent.
Answer: 10%
6.
\dfrac{312}{400} = 0.78 = 78\%Divide, then change to a percent.
Answer: 78%; no, a call-in poll is a voluntary response sample, so it does not represent the population
7.
4.5 - 3.0 = 1.5
Subtract the true mean from the sample mean.
Answer: 1.5 hours
8.
\text{sensitive question, asked in person}Students may not admit it.
Answer: response bias; the percent who admit cheating will likely be too low
9.
\text{same method, more people}A bigger sample still misses in the same direction.
Answer: no; a larger sample reduces chance error but not bias
10.
100\% - 23\% = 77\%
Most of the people chosen did not respond.
Answer: follow up with reminders or phone calls to people who did not respond (shorter surveys and small rewards also help)
Sampling bias FAQ
What is sampling bias?
It is a problem in how a sample is collected that makes the results miss the population value in the same direction again and again.
What are the types of sampling bias?
The main types are voluntary response, convenience sampling, undercoverage, nonresponse and response bias.
What is the difference between undercoverage and nonresponse?
Undercoverage means some people are never on the list, so they can’t be chosen. Nonresponse means people were chosen but didn’t answer.
Does a larger sample reduce bias?
No. A larger sample reduces sampling variability, the chance error. It does not fix bias, because a biased method misses the same way every time.
Summary
- Bias is a miss in the same direction, again and again. It comes from how the data are collected.
- Voluntary response and convenience samples are biased ways to choose a sample.
- Undercoverage leaves groups off the list; nonresponse loses people who were chosen.
- Response bias comes from question wording, the interviewer or sensitive topics.
- A bigger sample does not fix bias. Say which way the bias likely pushes the results.
Previous lesson: Sampling Methods
Next lesson: Observational Studies and Experiments
Back to the Statistics Index