
Observational Studies and Experiments
An observational study watches individuals and measures variables without changing anything. An experiment deliberately gives treatments to individuals to see how they respond. Only a well-designed experiment with random assignment can show cause and effect. An observational study can show a link, but other variables might explain it.
Before this lesson: Sampling Methods, Sampling Bias and Two-Way Tables
Observing versus doing something
Suppose you want to know if music lessons help students do better in school. You could find students who already take lessons and compare their grades with students who don’t. You didn’t change anything, so that is an observational study.
Or you could take a group of students and use chance to decide who gets lessons and who doesn’t. Now you imposed a treatment, so that is an experiment.
The difference matters. In the observational study, students who choose music lessons may also have more family support or more spare time. Those other differences could be what raises grades.
Key words
- Explanatory variable: the variable that may explain or cause a change (music lessons).
- Response variable: the outcome you measure (grades).
- Treatment: a condition given to the individuals in an experiment.
- Confounding variable: a variable linked to both the explanatory variable and the response, so you can’t tell which one caused the change (family support).
- Random assignment: using chance to put individuals into treatment groups.
Observational studies can be retrospective, looking back at past data, or prospective, following people forward in time.
What a study lets you conclude
Two kinds of randomness answer two different questions. Random sampling lets you generalize to the population. Random assignment lets you claim cause and effect.
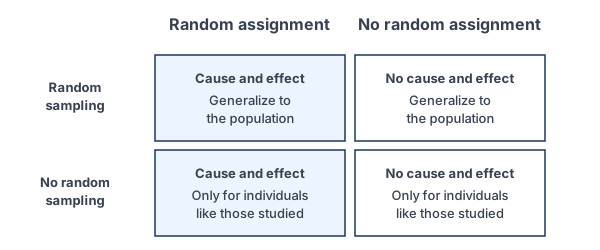
Observational study and experiment examples
Example 1: Identify the type of study
Researchers ask 500 adults how many cups of coffee they drink per day and how many hours they sleep. Is this an observational study or an experiment? Name the variables.
\text{no treatment imposed}The researchers only record what the adults already do.
\text{explanatory: cups of coffee}This variable may explain the outcome.
\text{response: hours of sleep}This is the outcome measured.
Answer: an observational study. The explanatory variable is coffee per day, and the response variable is hours of sleep.
Example 2: Recognize an experiment
A teacher has 60 volunteers. She uses a random number generator to put 30 students on a flashcard app and 30 on a practice-quiz app for two weeks. Then all take the same vocabulary test. Identify the study type, the treatments and the response.
\text{treatments imposed by chance}The teacher decides which app each student uses, by random assignment.
\text{treatments: flashcard app, quiz app}List the two conditions.
\text{response: vocabulary test score}This is the outcome measured.
Answer: an experiment with two treatments. If the quiz group scores clearly higher, the teacher can say the app caused the difference, at least for students like these volunteers.
Example 3: Spot a confounding variable
In an observational study (example data), 80 students who play an instrument have a mean GPA of 3.4. The other 120 students have a mean GPA of 3.0. A newspaper says, “Playing music raises your GPA.” Find the difference, and explain the problem.
3.4 - 3.0 = 0.4
Subtract the means.
\text{no random assignment}Students chose whether to play.
\text{confounding: family income}Families with more money may pay for lessons and also for tutoring, books and quiet study space.
Answer: the music group’s mean GPA is 0.4 higher. But this is an observational study, so a confounding variable like family income could explain the gap. The headline’s cause-and-effect claim is not supported.
Example 4: Compare rates in an observational study
A health survey (example data) follows 1,000 adults through one winter. Of the 400 who take vitamin D, 32 catch the flu. Of the 600 who don’t, 72 catch the flu. Compare the flu rates.
\dfrac{32}{400} = 0.08 = 8\%Find the flu rate for the vitamin D group (see percentages).
\dfrac{72}{600} = 0.12 = 12\%Find the flu rate for the other group.
12\% - 8\% = 4\%
Subtract the rates.
Answer: the vitamin D group’s flu rate is 4 percentage points lower. Because people chose to take vitamin D, they may also exercise more or eat better. An experiment with random assignment would be needed to show that vitamin D prevents the flu.
Example 5: What can the study conclude? (word problem)
A city health department chooses an SRS of 300 adults from its residents. It randomly assigns 150 to a daily 30-minute walking program and 150 to no program. After 3 months, the walking group’s mean blood pressure dropped by 6 points more. What can the department conclude?
\text{random sample from the city}Random sampling: the results can be generalized to adults in the city.
\text{random assignment to groups}Random assignment: the groups were alike at the start, so the program can be the cause.
\text{both: top-left cell of the grid}Use the scope-of-inference grid.
Answer: walking caused the larger drop in blood pressure, and this conclusion applies to adults in the city. Studies with both kinds of randomness are rare, because random samples of people often won’t agree to follow a treatment.
Common mistakes
| Mistake | Example of the error | Fix |
|---|---|---|
| Claiming cause from an observational study | “Students who play music get better grades, so music raises grades.” | Say the variables are linked. Only an experiment with random assignment shows cause. |
| Calling any study with groups an experiment | Comparing smokers and nonsmokers and calling it an experiment | Ask: did the researchers assign the treatment? If people chose, it is observational. |
| Mixing up random sampling and random assignment | “It was a random sample, so we can claim cause.” | Random sampling lets you generalize. Random assignment lets you claim cause. |
| Overreaching with volunteers | Applying an experiment on 60 volunteers to all students in the country | Without random sampling, the results apply to individuals like those studied. |
| Not naming a real confounder | “Something else could cause it.” | Name one, and explain how it is linked to both variables. |
Related methods
Correlation is not causation
A strong correlation coefficient in an observational study still doesn’t show cause, as the scatter plots and correlation lesson warns. The same goes for differences between groups found by comparing distributions.
Designing a good experiment
The next lesson, Experimental Design, covers control groups, random assignment, replication and blinding: the parts that make an experiment’s results trustworthy.
Practice problems
- A researcher surveys 400 teens about hours of TV per week and their grades. Is this an observational study or an experiment?
- Doctors randomly assign 200 patients to take a new drug or a placebo (a fake pill). Is this an observational study or an experiment?
- In problem 2, name the explanatory variable and the response variable if the doctors measure blood sugar.
- In an observational study, 50 of 250 smokers and 30 of 750 nonsmokers develop a lung disease. Find each rate. Does this study prove smoking causes the disease?
- Towns with more ice cream sales have more drownings. Name a likely confounding variable.
- In an observational study, people who meditate have a mean stress score of 65 and others have 72. Find the difference, and say whether meditation lowers stress.
- A study takes a random sample of 1,000 voters but does not assign any treatment. What can it conclude?
- An experiment randomly assigns 80 volunteers to two diets. What can it conclude, and about whom?
- Why can’t researchers run an experiment to see whether smoking causes lung disease?
- Researchers look through 10 years of hospital records to compare patients who did and didn’t take a medicine. Is this study retrospective or prospective?
Show answers
1.
\text{no treatment imposed}The researcher only records what teens already do.
Answer: an observational study
2.
\text{treatments assigned by chance}The doctors decide who gets the drug.
Answer: an experiment
3.
\text{explanatory: drug or placebo}This is the treatment.
\text{response: blood sugar}This is the outcome measured.
Answer: explanatory variable is the treatment (drug or placebo); response variable is blood sugar
4.
\dfrac{50}{250} = 0.2 = 20\%Smokers’ rate.
\dfrac{30}{750} = 0.04 = 4\%Nonsmokers’ rate.
Answer: 20% versus 4%; no, this study alone can’t prove cause, because people chose whether to smoke (many studies together, plus lab evidence, are what make the case)
5.
\text{hot weather}Heat raises both ice cream sales and swimming.
Answer: temperature or season
6.
72 - 65 = 7
Subtract the means.
Answer: the meditation group’s mean is 7 points lower, but this observational study can’t show that meditation lowers stress
7.
\text{random sampling, no random assignment}Use the scope-of-inference grid.
Answer: it can describe links among all voters, but it can’t show cause and effect
8.
\text{random assignment, no random sampling}Use the scope-of-inference grid.
Answer: it can show that diet causes differences, but only for people like these volunteers
9.
\text{assigning smoking would harm people}Experiments must be ethical.
Answer: it would be unethical to make people smoke, so researchers use observational studies instead
10.
\text{looks back at past records}The data were already collected.
Answer: retrospective
Observational studies and experiments FAQ
What is the main difference between an observational study and an experiment?
In an experiment, the researcher imposes a treatment. In an observational study, the researcher only observes and records what already happens.
Why can’t observational studies show cause and effect?
The groups may differ in other ways, called confounding variables. Without random assignment, you can’t rule those out as the real cause.
What is a confounding variable?
It is a variable linked to both the explanatory variable and the response, so its effect gets mixed up with the effect you are studying.
What is the difference between random sampling and random assignment?
Random sampling chooses who is in the study, so you can generalize to the population. Random assignment chooses which treatment each person gets, so you can claim cause and effect.
Summary
- An observational study records data without changing anything. An experiment imposes treatments.
- The explanatory variable may cause changes in the response variable.
- Confounding variables make cause-and-effect claims from observational studies unsafe.
- Random assignment allows cause-and-effect claims. Random sampling allows claims about the population.
- Some questions can only be studied by observation, because an experiment would be unethical.
Previous lesson: Sampling Bias
Next lesson: Experimental Design
Back to the Statistics Index