
Sampling Methods
Sampling methods are ways to choose a sample, a smaller group, from a population. The four main random methods are the simple random sample, the stratified random sample, the cluster sample and the systematic sample. Random sampling helps the sample represent the whole population, so its results can be trusted.
Before this lesson: Probability, Percentages and Categorical and Quantitative Variables
Populations, samples and why we sample
The population is the whole group you want to learn about, such as every student at a school. A sample is the part of the population you actually collect data from. A census collects data from everyone, but that is often too slow or too costly.
A number that describes a sample, like the sample mean, is a statistic. A number that describes the whole population is a parameter. We use the statistic to estimate the parameter, so the sample needs to look like the population.
The best way to get a fair sample is to let chance choose. Chance doesn’t play favorites, so no group is left out on purpose. Choosing people because they are easy to reach, called a convenience sample, often gives misleading results.
The four random sampling methods
| Method | How it works | Example |
|---|---|---|
| Simple random sample (SRS) | Every group of n individuals has the same chance to be chosen. | Draw 50 names at random from a list of all 1,200 students. |
| Stratified random sample | Split the population into groups of similar individuals (strata). Take an SRS from each stratum. | Take an SRS of 15 students from each grade, 9 to 12. |
| Cluster sample | Split the population into groups (clusters) that each look like the population. Pick some clusters at random and use everyone in them. | Pick 3 homerooms at random and survey every student in them. |
| Systematic random sample | Pick a random start, then take every kth individual from a list or line. | Start at a random number from 1 to 20, then take every 20th student on the list. |
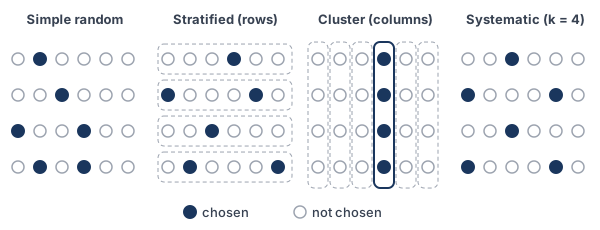
The key difference: a stratified sample takes some individuals from every group. A cluster sample takes every individual from some groups.
Sampling method examples
Example 1: Choose a simple random sample
A school has 1,200 students. The principal wants an SRS of 5 students to interview. Show how to choose them with a calculator.
\text{Label: } 1, 2, 3, \dots, 1200Give each student on the school list a number.
\text{randInt(1, 1200)}On a TI-84, press MATH, PRB, 5:randInt and enter 1 and 1200.
845, \; 112, \; 1093, \; 845, \; 307, \; 652
Press ENTER until you have 5 different numbers (example output).
845 \text{ repeats, so skip it}A student can’t be chosen twice.
\{845, 112, 1093, 307, 652\}List the 5 chosen labels.
Answer: interview students 112, 307, 652, 845 and 1093 on the list. Every group of 5 students had the same chance to be picked, so this is an SRS.
Example 2: Choose a systematic sample
A store wants to survey 30 of the 600 customers who come in on Saturday. Describe a systematic sample and find the last customer chosen.
k = \dfrac{600}{30} = 20Divide the population size by the sample size to find the gap k.
\text{randInt(1, 20)} = 7Choose a random start from 1 to 20 (example output).
7, \; 27, \; 47, \; \dots
Add 20 each time.
7 + 29(20)
The 30th customer is 29 gaps after the first.
7 + 580 = 587
Multiply, then add.
Answer: survey customers 7, 27, 47 and so on, ending with customer 587. Systematic samples are quick, but they can go wrong if the list has a repeating pattern that matches k.
Example 3: Choose a stratified random sample
A high school has 320 ninth graders, 300 tenth graders, 280 eleventh graders and 300 twelfth graders. The school wants a stratified sample of 60 students, with each grade in proportion to its size. How many students come from each grade?
320 + 300 + 280 + 300 = 1200
Add to find the population size.
\dfrac{60}{1200} = 0.05Find the fraction of the population to sample (see proportions).
0.05(320) = 16
Ninth graders.
0.05(300) = 15
Tenth graders.
0.05(280) = 14
Eleventh graders.
0.05(300) = 15
Twelfth graders.
16 + 15 + 14 + 15 = 60
Check that the total is 60.
Answer: take an SRS of 16 ninth graders, 15 tenth graders, 14 eleventh graders and 15 twelfth graders. Every grade is represented, which makes the estimate more precise when the grades differ.
Example 4: Choose a cluster sample
The same school has 48 homerooms of about 25 students each, and every homeroom mixes all four grades. The school wants about 75 students. Describe a cluster sample.
\dfrac{75}{25} = 3Find how many homerooms give about 75 students.
\text{Label homerooms } 1 \text{ to } 48Number the clusters.
\text{randInt(1, 48)}: \; 9, \; 31, \; 44Choose 3 different homerooms at random (example output).
Answer: survey every student in homerooms 9, 31 and 44, about 75 students in all. This is cheaper than finding 75 students all over the building. It works because each homeroom looks like the whole school.
Example 5: Which method fits? (word problem)
A grocery chain has 12 stores. It wants about 80 customer opinions from one store, which gets about 800 customers a day, and it also wants opinions from several stores. Name a method for each goal.
k = \dfrac{800}{80} = 10One store: customers arrive in a line, so take every 10th customer after a random start from 1 to 10.
\text{randInt(1, 12)}Several stores: pick a few stores at random and survey customers at each one.
Answer: at one store, use a systematic sample of every 10th customer. Across the chain, a cluster sample of randomly chosen stores saves travel. If the stores serve very different neighborhoods, a stratified sample with some customers from every store would be more precise.
Common mistakes
| Mistake | Example of the error | Fix |
|---|---|---|
| Mixing up stratified and cluster | Calling “pick 3 homerooms and survey everyone” stratified | Stratified: some from every group. Cluster: everyone in some groups. |
| Calling any sample random | Surveying the first 30 students in the lunch line | That is a convenience sample. Random means chance chooses, as with randInt. |
| Keeping repeats in an SRS | Interviewing student 845 twice | Skip numbers that repeat or are outside the labels. |
| Forgetting the random start | Always starting a systematic sample at 1 | Choose the start at random from 1 to k. |
| Strata that are not similar inside | Splitting students by the first letter of their last name | Strata should group similar individuals, like students in the same grade. |
| Using the wrong gap k | k = 30 \div 600 | Divide the population size by the sample size: k = 600 \div 30 = 20. |
Related methods
Random digit tables
Before calculators, people chose samples with a table of random digits. Give each individual a label with the same number of digits, read the digits in groups of that size, and skip labels that are too big or that repeat. Practice problem 7 uses this method.
What comes next
A random method is only the start. The next lesson, Sampling Bias, shows how samples can still go wrong, for example when people don’t respond. Data from a good sample can then be summarized with tools like the mean and median or a two-way table.
Practice problems
- A teacher writes all 30 students’ names on slips, mixes them in a hat and draws 5. What kind of sample is this?
- A factory tests every 50th bottle on the line, starting from a random bottle among the first 50. What kind of sample is this?
- A city picks 4 of its 40 neighborhoods at random and surveys every home in those 4. What kind of sample is this?
- A college takes an SRS of 50 first-year students, 50 second-year students, 50 third-year students and 50 fourth-year students. What kind of sample is this?
- A list has 900 names, and you want a systematic sample of 45. Find k. If the random start is 13, list the first three names chosen and the last one.
- A club has 120 adult members and 80 teen members. Find how many of each to include in a proportional stratified sample of 25.
- Label 40 students 01 to 40. Use the random digits 82073 61907 44259, read in pairs from left to right, to choose 4 students.
- A reporter surveys the first 50 students to walk into the cafeteria. Why is this not a simple random sample?
- A population has three strata of 500, 300 and 200 people. Find the number from each stratum in a proportional stratified sample of 80.
- When should you use a stratified sample instead of a cluster sample?
Show answers
1.
\text{every group of 5 equally likely}Each set of 5 slips has the same chance to be drawn.
Answer: a simple random sample
2.
k = 50
Every 50th bottle after a random start.
Answer: a systematic random sample
3.
\text{all homes in 4 random neighborhoods}Whole groups are chosen.
Answer: a cluster sample
4.
\text{an SRS from each year}Some students come from every group.
Answer: a stratified random sample
5.
k = \dfrac{900}{45} = 20Divide the population size by the sample size.
13, \; 33, \; 53
Start at 13 and add 20 each time.
13 + 44(20) = 13 + 880 = 893
The 45th name is 44 gaps after the first.
Answer: k = 20; names 13, 33 and 53 first, and name 893 last
6.
120 + 80 = 200
Find the population size.
\dfrac{25}{200} = 0.125Find the sampling fraction.
0.125(120) = 15
Adults.
0.125(80) = 10
Teens.
Answer: 15 adults and 10 teens
7.
82, \; 07, \; 36, \; 19, \; 07, \; 44, \; 25
Split the digits into pairs.
82 \gt 40, \; 44 \gt 40
Skip labels above 40.
07 \text{ appears twice}Skip the repeat.
Answer: students 07, 36, 19 and 25
8.
\text{first 50 to arrive}Students who come early are not chosen by chance and may differ from others.
Answer: not every group of 50 students has the same chance to be chosen; it is a convenience sample
9.
500 + 300 + 200 = 1000
Find the population size.
\dfrac{80}{1000} = 0.08Find the sampling fraction.
0.08(500) = 40, \; 0.08(300) = 24, \; 0.08(200) = 16
Multiply each stratum size by 0.08.
Answer: 40, 24 and 16
10.
\text{strata differ from each other}Stratified samples work best when the groups are different from each other but similar inside.
Answer: use stratified when the groups differ (like grades or regions) and you want every group represented; use cluster when each group looks like the whole population and reaching whole groups is cheaper
Sampling methods FAQ
What are the 4 types of random sampling?
Simple random, stratified random, cluster and systematic random sampling. Each one uses chance to decide who is in the sample.
What is the difference between stratified and cluster sampling?
A stratified sample takes some individuals from every group. A cluster sample picks a few groups at random and uses everyone in them.
Is a systematic sample a simple random sample?
No. In a systematic sample, two people who are next to each other on the list can never both be chosen, so not every group of n has the same chance.
Why is random sampling important?
Chance doesn’t favor any group, so a random sample tends to look like the population. That lets you use the sample to make claims about the whole population.
Summary
- A sample is part of a population. A statistic from the sample estimates a parameter of the population.
- Simple random sample: every group of n has the same chance to be chosen.
- Stratified: an SRS from every stratum (groups of similar individuals).
- Cluster: everyone in a few randomly chosen clusters.
- Systematic: a random start, then every kth individual, with k = \tfrac{\text{population size}}{\text{sample size}}.
Previous lesson: Transformations to Achieve Linearity
Next lesson: Sampling Bias
Back to the Statistics Index