
Experimental Design
Experimental design is the plan for how an experiment gives treatments and measures results. A good design compares two or more treatments, often including a control group, uses random assignment to form the groups, and has enough subjects in each group. Blinding and placebos keep expectations from changing the results.
Before this lesson: Observational Studies and Experiments, Sampling Methods and Percentages
The parts of an experiment
An experiment tests what happens when you change something on purpose. To describe one clearly, statisticians use a few key words.
- Experimental units: the individuals that get the treatments. When they are people, they are called subjects.
- Factor: an explanatory variable the researcher controls, such as the dose of a drug.
- Level: a specific value of a factor, such as 0 mg, 10 mg or 20 mg.
- Treatment: one combination of levels that units receive.
- Response variable: the outcome you measure.
With more than one factor, the number of treatments is the product of the numbers of levels. Two factors with 3 and 2 levels give 3 \times 2 = 6 treatments.
Four principles of experimental design
- Comparison: compare two or more treatments. Often one is a control group that gets no treatment, a placebo or the usual treatment.
- Random assignment: use chance to decide which units get which treatment. This makes the groups alike, on average, before the treatments start.
- Control: keep other variables the same for every group, such as the time of day or the test used.
- Replication: give each treatment to enough units that chance differences don’t hide the effect.
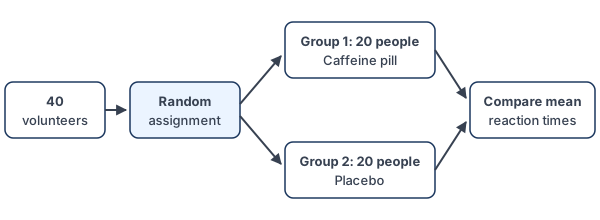
A design that puts every unit into a treatment group completely at random is called a completely randomized design.
Placebos and blinding
A placebo is a fake treatment, like a sugar pill. People often feel better just because they think they are being treated. This placebo effect is why a control group usually gets a placebo instead of nothing.
In a single-blind experiment, the subjects don’t know which treatment they get. In a double-blind experiment, neither the subjects nor the people who measure the response know. Blinding keeps expectations from changing the results.
Experimental design examples
Example 1: Factors, levels and treatments
A gardener tests 3 fertilizers (A, B and C) and 2 watering plans (daily and every other day) on 60 tomato plants. She measures the weight of tomatoes each plant produces. Identify the parts of the experiment and find how many plants get each treatment.
\text{units: 60 tomato plants}The plants receive the treatments.
\text{factors: fertilizer, watering}These are the variables she controls.
3 \times 2 = 6
Multiply the numbers of levels to find the number of treatments.
\dfrac{60}{6} = 10Divide the plants evenly among the treatments.
\text{response: weight of tomatoes}This is the outcome measured.
Answer: 2 factors (fertilizer with 3 levels, watering with 2 levels), 6 treatments, and 10 plants per treatment. The response is the weight of tomatoes per plant.
Example 2: Carry out random assignment
A researcher has 40 volunteers and wants 20 in each of two groups. Show how to assign them at random with a calculator.
\text{Label: } 1, 2, \dots, 40Give each volunteer a number.
\text{randInt(1, 40)}On a TI-84: MATH, PRB, 5:randInt.
\text{keep the first 20 different labels}Skip any repeats.
\text{those 20} \rightarrow \text{Group 1; the rest} \rightarrow \text{Group 2}The chosen labels form one group, and the others form the second.
Answer: the first 20 different numbers from randInt(1, 40) go to Group 1, and the other 20 volunteers go to Group 2. Another way is to put 40 slips, 20 marked 1 and 20 marked 2, in a hat and have each volunteer draw one.
Example 3: Design a double-blind experiment
A company wants to know if its caffeine pill speeds up reaction time. Outline a double-blind experiment for the 40 volunteers in Example 2.
\text{Group 1: caffeine pill; Group 2: placebo}Comparison: the placebo looks the same as the real pill.
\text{random assignment as in Example 2}Chance decides who gets which pill.
\text{same test, same time of day}Control: keep other variables the same for both groups.
\text{coded bottles}Blinding: neither the subjects nor the testers know who got caffeine.
Answer: randomly assign 20 volunteers to caffeine and 20 to a look-alike placebo. Give the same reaction test to everyone at the same time of day. Label the pills with codes so that nobody involved knows the groups until the end. Then compare the mean reaction times.
Example 4: Compare the results
In the caffeine experiment (example data), the caffeine group’s mean reaction time is 0.42 seconds, and the placebo group’s is 0.47 seconds. Also, 15 of the 20 caffeine subjects and 9 of the 20 placebo subjects said they felt more alert. Compare the groups.
0.47 - 0.42 = 0.05
Subtract the mean reaction times.
\dfrac{15}{20} = 0.75 = 75\%Find the percent of the caffeine group who felt more alert (see percentages).
\dfrac{9}{20} = 0.45 = 45\%Find the percent of the placebo group who felt more alert.
75\% - 45\% = 30\%
Subtract the percents.
Answer: the caffeine group reacted 0.05 seconds faster on average, and 30 percentage points more of them felt more alert. Notice that 45% of the placebo group also felt more alert: that is the placebo effect. Later lessons on hypothesis tests show how to decide if a difference this size is too big to be chance.
Example 5: Plan a keyboard experiment (word problem)
A phone maker has a new keyboard layout. It has 120 volunteers and wants to know if the new layout lets people type faster than the old layout. Plan the experiment, and say how many people each group needs.
\text{treatments: new layout, old layout}Comparison: the old layout is the control.
\dfrac{120}{2} = 60Replication: split the volunteers evenly.
\text{randInt(1, 120): first 60 different labels}Random assignment to the new layout; the rest use the old one.
\text{same phone model, same typing passage}Control other variables.
\text{response: words per minute}Measure the same outcome for everyone.
Answer: randomly assign 60 volunteers to each layout. Everyone types the same passage on the same phone model, and the company compares the mean words per minute. The volunteers can’t be blind to which layout they see, but the person scoring the typing can be.
Common mistakes
| Mistake | Example of the error | Fix |
|---|---|---|
| Letting subjects choose their group | Volunteers pick caffeine or placebo | Use random assignment, so the groups start out alike. |
| No comparison group | Giving everyone the caffeine pill and noting they feel alert | Include a control or placebo group to compare with. |
| Mixing up factors and treatments | Saying the tomato study has 5 treatments (3 + 2) | Multiply levels: 3 \times 2 = 6 treatments. |
| Confusing random assignment with random sampling | “We took a random sample, so we did random assignment.” | Random assignment puts the subjects you have into groups by chance. |
| Thinking replication means repeating the whole study | Using 2 plants per treatment and calling it replicated because you ran it twice | Within a study, replication means enough units in each treatment group. |
| Forgetting the placebo effect | Counting every “I feel better” as proof the drug works | Compare with a placebo group, which also reports feeling better. |
Related methods
Blocking and matched pairs
When subjects differ in a way that affects the response, such as age, you can first group similar subjects and randomize within each group. The next lesson, Block Designs and Matched Pairs, shows how this reduces variation.
Analyzing the results
Results from an experiment are summarized like any data: with means, percents, two-way tables and the tools from comparing distributions. Because of random assignment, a clear difference can be called a cause, as explained in observational studies and experiments.
Practice problems
- A school tests whether a new reading program raises test scores. 80 students are randomly split between the new program and the old one. Name the experimental units, the treatments and the response variable.
- An experiment has 2 factors, one with 4 levels and one with 3 levels. How many treatments are there?
- The experiment in problem 2 has 96 subjects split evenly. How many subjects get each treatment?
- Why does an experiment need a control group?
- What is the placebo effect?
- In a double-blind experiment, who doesn’t know which treatment each subject gets?
- Label 20 subjects 01 to 20. Use the random digits 16 04 19 04 11 25 07, in order, to choose 4 subjects for Group A.
- In an experiment, 30 of 50 people on a new allergy spray and 20 of 50 on a placebo spray report relief. Find each percent and the difference.
- What does replication mean in experimental design?
- Why is it a problem to let volunteers choose which treatment they get?
Show answers
1.
\text{units: 80 students}They receive the treatments.
\text{treatments: new program, old program}These are the conditions compared.
Answer: units are the 80 students; treatments are the new and old reading programs; response is the test score
2.
4 \times 3 = 12
Multiply the numbers of levels.
Answer: 12 treatments
3.
\dfrac{96}{12} = 8Divide the subjects evenly among the treatments.
Answer: 8 subjects per treatment
4.
\text{comparison}Without a control group, you can’t tell what would have happened anyway.
Answer: it gives a baseline, so you can see whether the treatment does better than no treatment or the usual one
5.
\text{belief in treatment}Expectations alone can change how people feel.
Answer: people respond to a fake treatment because they believe they are being treated
6.
\text{subjects and evaluators}Both groups are kept unaware.
Answer: neither the subjects nor the people who measure the response know
7.
16, \; 04, \; 19, \; 04, \; 11
Read the pairs in order.
04 \text{ repeats, so skip it}A subject can’t be chosen twice.
Answer: subjects 16, 04, 19 and 11
8.
\dfrac{30}{50} = 0.6 = 60\%New spray.
\dfrac{20}{50} = 0.4 = 40\%Placebo spray.
60\% - 40\% = 20\%
Subtract.
Answer: 60% versus 40%, a difference of 20 percentage points
9.
\text{enough units per treatment}More units make chance differences between groups smaller.
Answer: giving each treatment to enough experimental units that the results aren’t just chance
10.
\text{self-selection}People who choose a treatment may differ in other ways.
Answer: the groups may differ before the study starts, which creates confounding; random assignment prevents this
Experimental design FAQ
What are the four principles of experimental design?
Comparison of treatments, random assignment, control of other variables and replication (enough units in each treatment).
What is a completely randomized design?
It is a design where every experimental unit is put into a treatment group completely at random, without grouping units first.
What is the difference between single-blind and double-blind?
In single-blind, only the subjects don’t know their treatment. In double-blind, neither the subjects nor the people measuring the response know.
How do you find the number of treatments?
Multiply the number of levels of each factor. For example, 2 factors with 3 levels and 4 levels give 12 treatments.
Summary
- Experimental units get treatments. A factor is a variable the researcher controls, and its values are levels.
- Number of treatments = product of the numbers of levels.
- Four principles: comparison, random assignment, control and replication.
- A placebo group shows the placebo effect. Double-blind means neither subjects nor evaluators know the groups.
- In a completely randomized design, chance alone decides every unit’s treatment.
Previous lesson: Observational Studies and Experiments
Next lesson: Block Designs and Matched Pairs
Back to the Statistics Index