
Bar Graphs and Pie Charts
Bar graphs and pie charts are the two main graphs for categorical data. A bar graph uses separated bars whose heights show the count or percent in each category. A pie chart splits a circle into slices, one per category, sized by its share of the whole. Use a pie chart only when the parts make up one whole.
Before this lesson: Categorical and Quantitative Variables, Percentages and Two-Way Tables
What bar graphs and pie charts show
A categorical variable sorts individuals into groups, such as favorite sport or way to school. To graph it, first count how many individuals fall in each group. That list of counts is a frequency table, and each count is a frequency.
A relative frequency is a count divided by the total, so it is a proportion or percent. Relative frequencies let you compare groups of different sizes, and they always add to 1 (or 100%).
A bar graph and a pie chart can show the same data. The bar graph makes it easy to compare categories with each other. The pie chart shows how each category compares with the whole.
Bar graph and pie chart rules
| Step | Bar graph | Pie chart |
|---|---|---|
| 1. Make a frequency table | Count each category | Count each category |
| 2. Find what to plot | Counts, or relative frequencies \dfrac{\text{count}}{\text{total}} | Relative frequencies \dfrac{\text{count}}{\text{total}} |
| 3. Draw | One bar per category, equal widths, with gaps between bars | Slice angle = \text{relative frequency} \times 360^\circ |
| 4. Label | Title, category names, a count or percent axis that starts at 0 | Title, category names and percents on the slices |
Two rules keep these graphs honest. A pie chart needs categories that do not overlap and that cover the whole group, so the percents add to exactly 100%. A bar graph’s count axis should start at 0, because the eye compares bar heights.
Bar graph and pie chart examples
Example 1: Frequency table and relative frequencies
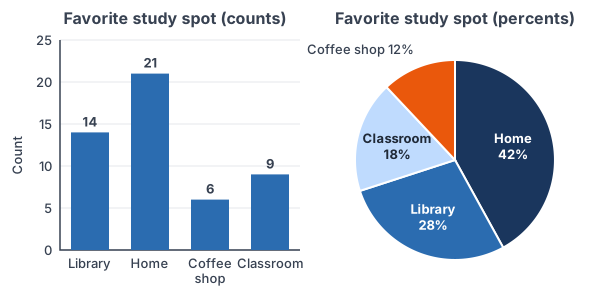
A survey asks 50 students where they like to study (example data): library 14, home 21, coffee shop 6 and classroom 9. Find the relative frequency of each answer.
\text{Total} = 14 + 21 + 6 + 9Add the counts to find how many students answered.
\text{Total} = 50Simplify. This matches the 50 students surveyed.
\text{Library: } \dfrac{14}{50} = 0.28Divide the count by the total.
0.28 = 28\%
Change the decimal to a percent (see percentages).
\text{Home: } \dfrac{21}{50} = 0.42 = 42\%Repeat for home.
\text{Coffee shop: } \dfrac{6}{50} = 0.12 = 12\%Repeat for coffee shop.
\text{Classroom: } \dfrac{9}{50} = 0.18 = 18\%Repeat for classroom.
0.28 + 0.42 + 0.12 + 0.18 = 1.00
Check: the relative frequencies add to 1.
On a TI-84: press STAT, choose 1:Edit and type the counts 14, 21, 6, 9 into L1. Move to the top of L2, type L1/sum(L1) and press ENTER (sum( is under 2nd, LIST, MATH, 5). L2 shows 0.28, 0.42, 0.12 and 0.18.
In Desmos: type c = [14, 21, 6, 9] on one line and c/total(c) on the next. Desmos lists the same four relative frequencies.
Answer: library 28%, home 42%, coffee shop 12%, classroom 18%. The bar graph above uses the counts; the pie chart uses these percents.
Example 2: Find the slice angles for a pie chart
Use the relative frequencies from Example 1 to find the angle of each slice in the pie chart.
\text{Angle} = \text{relative frequency} \times 360^\circA full circle is 360°, so each slice gets its share of 360°.
\text{Library: } 0.28 \times 360^\circ = 100.8^\circMultiply the library share by 360°.
\text{Home: } 0.42 \times 360^\circ = 151.2^\circMultiply the home share by 360°.
\text{Coffee shop: } 0.12 \times 360^\circ = 43.2^\circMultiply the coffee shop share by 360°.
\text{Classroom: } 0.18 \times 360^\circ = 64.8^\circMultiply the classroom share by 360°.
100.8^\circ + 151.2^\circ + 43.2^\circ + 64.8^\circ = 360^\circ
Check: the slices fill the whole circle.
In Desmos, 360c/total(c) gives all four angles at once. Answer: 100.8°, 151.2°, 43.2° and 64.8°. Draw each slice with a protractor, or let software draw it from the percents.
Example 3: Read a pie chart (word problem)
A pie chart shows how 800 teens mostly listen to music (example data): streaming app 55%, video site 25%, radio 15% and other 5%. How many teens chose a video site? How many more chose a streaming app than a video site? What is the angle of the radio slice?
0.25 \times 800 = 200
Change 25% to 0.25 and multiply by the total to get the video-site count.
0.55 \times 800 = 440
Find the streaming-app count the same way.
440 - 200 = 240
Subtract to compare the two groups.
0.15 \times 360^\circ = 54^\circ
Multiply the radio share by 360° for its slice angle.
Answer: 200 teens chose a video site, 240 more chose a streaming app than a video site, and the radio slice is 54°.
Example 4: Compare two groups with a segmented bar graph
A school asks 9th and 12th graders how they get to school (example data). Of 60 ninth graders, 27 ride the bus, 18 come by car and 15 walk. Of 40 twelfth graders, 10 ride the bus, 22 come by car and 8 walk. Are 12th graders more likely to come by car?
18 \lt 22
Compare the raw car counts. They look close, but the groups have different sizes, so counts can mislead.
\text{9th, car: } \dfrac{18}{60} = 0.30 = 30\%Divide by the size of the 9th-grade group.
\text{12th, car: } \dfrac{22}{40} = 0.55 = 55\%Divide by the size of the 12th-grade group.
\text{9th, bus: } \dfrac{27}{60} = 45\%, \; \text{walk: } \dfrac{15}{60} = 25\%Find the other 9th-grade percents.
\text{12th, bus: } \dfrac{10}{40} = 25\%, \; \text{walk: } \dfrac{8}{40} = 20\%Find the other 12th-grade percents.
45\% + 30\% + 25\% = 100\%, \; 25\% + 55\% + 20\% = 100\%
Check: each grade’s percents add to 100%.
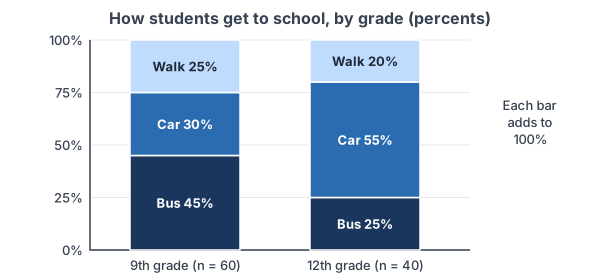
Answer: yes. 55% of 12th graders come by car, compared with 30% of 9th graders. A segmented bar graph (also called a stacked bar graph) shows this clearly: each bar is one group, and the pieces of the bar are its percents.
Example 5: Spot a misleading bar graph
An ad shows a bar graph of customer satisfaction: Brand A 52% and Brand B 48%. The vertical axis starts at 46%, not 0%. How many times taller does Brand A’s bar look, and how many times larger is its real percent?
52 - 46 = 6
The visible height of Brand A’s bar is the part above 46.
48 - 46 = 2
The visible height of Brand B’s bar.
\dfrac{6}{2} = 3Brand A’s bar looks 3 times as tall.
\dfrac{52}{48} \approx 1.08The real percents differ by a factor of only about 1.08.
Answer: the bar looks 3 times as tall, but Brand A’s real rate is only about 8% higher. Start the axis at 0 so bar heights match the data.
Common mistakes
| Mistake | Example of the error | Fix |
|---|---|---|
| Using a pie chart when answers can overlap | “Which sports do you play? Pick all that apply” gives percents that add to 140% | Use a bar graph. A pie chart needs parts of one whole that add to 100%. |
| Using the percent as the angle | Drawing a 28% slice as 28° | Multiply by 360°: 0.28 × 360° = 100.8°. |
| Comparing counts for groups of different sizes | “More 9th graders ride the bus (27 vs. 10), so 9th graders bus more” without checking group sizes | Compare relative frequencies: 45% vs. 25%. |
| Starting the count axis above 0 | An axis from 46% makes 52% look 3 times as big as 48% | Start a bar graph’s axis at 0. |
| Drawing touching bars | Bars for bus, car and walk pressed together like a histogram | Leave gaps. Touching bars are for histograms of quantitative data. |
| Using 3D or exploded slices | A tilted 3D pie chart makes the front slice look bigger | Use a flat chart, and label each slice with its percent. |
Related methods
Two categorical variables
When you have two categorical variables, such as grade and way to school, start with a two-way table. Then compare groups with a side-by-side bar graph (bars for each group placed next to each other) or a segmented bar graph like the one in Example 4. If the segments look about the same for every group, the variables show no association.
Ordered bars and quantitative data
A Pareto chart is a bar graph with the bars sorted from tallest to shortest, which makes the most common categories easy to spot. For quantitative data, use number-line graphs instead, such as dot plots and histograms, or stem-and-leaf plots, the topic of the next lesson. The categorical and quantitative variables lesson shows how to decide which kind of data you have.
Practice problems
- In a survey of 30 people (example data), 12 have a dog, 9 a cat, 3 a fish and 6 no pet. Find the relative frequency of each answer.
- Use your answer to Problem 1. What is the angle of the cat slice in a pie chart?
- A pie chart of 250 voters shows that 18% chose Candidate C. How many voters chose Candidate C?
- A pie chart slice has an angle of 72°. What percent of the data is in that slice? If 400 people were surveyed, how many is that?
- A survey asks, “Which streaming services do you use? Choose all that apply.” Should the results go in a pie chart or a bar graph? Explain.
- A bar graph shows 120 survey answers. The bars for A, B and C show 42, 30 and 27. The bar for D is missing. Find the count for D and its percent.
- School A has 200 students, and 50 of them bike to school. School B has 120 students, and 36 bike. Which school has the higher percent of bikers?
- A bar graph shows two values, 30 and 33, with a vertical axis that starts at 28. How many times taller does the second bar look? What is the real ratio?
- Counts for four groups are 18, 27, 9 and 6. Find each relative frequency and pie-slice angle, and give the Desmos or TI-84 steps.
- Of 80 juniors, 52 say yes to a later start time; of 70 seniors, 35 say yes. Find the percent who say yes in each group, and say whether a segmented bar graph would show an association.
Show answers
1.
12 + 9 + 3 + 6 = 30
Add the counts to check the total.
\dfrac{12}{30} = 0.40, \; \dfrac{9}{30} = 0.30Divide the dog and cat counts by the total.
\dfrac{3}{30} = 0.10, \; \dfrac{6}{30} = 0.20Divide the fish and no-pet counts by the total.
0.40 + 0.30 + 0.10 + 0.20 = 1.00
Check that they add to 1.
Answer: dog 40%, cat 30%, fish 10%, no pet 20%
2.
0.30 \times 360^\circ = 108^\circ
Multiply the cat share by 360°.
Answer: 108°
3.
0.18 \times 250 = 45
Change 18% to 0.18 and multiply by the total.
Answer: 45 voters
4.
\dfrac{72^\circ}{360^\circ} = 0.20Divide the slice angle by the full circle.
0.20 = 20\%
Change to a percent.
0.20 \times 400 = 80
Multiply by the number surveyed.
Answer: 20%, which is 80 people
5.
\text{Answers can overlap}One person can pick several services, so the percents can add to more than 100%.
Answer: a bar graph, with one bar per service showing the percent who use it. A pie chart needs parts of one whole.
6.
42 + 30 + 27 = 99
Add the known counts.
120 - 99 = 21
Subtract from the total to get D.
\dfrac{21}{120} = 0.175 = 17.5\%Divide by the total and change to a percent.
Answer: D has 21 answers, which is 17.5%
7.
\text{A: } \dfrac{50}{200} = 0.25 = 25\%Find School A’s relative frequency.
\text{B: } \dfrac{36}{120} = 0.30 = 30\%Find School B’s relative frequency.
Answer: School B (30% vs. 25%), even though School A has more bikers
8.
30 - 28 = 2, \; 33 - 28 = 5
Find each bar’s visible height above 28.
\dfrac{5}{2} = 2.5Compare the visible heights.
\dfrac{33}{30} = 1.1Compare the real values.
Answer: the second bar looks 2.5 times as tall, but its value is only 1.1 times as large
9.
18 + 27 + 9 + 6 = 60
Add the counts.
\dfrac{18}{60} = 0.30, \; \dfrac{27}{60} = 0.45, \; \dfrac{9}{60} = 0.15, \; \dfrac{6}{60} = 0.10Divide each count by 60.
0.30 \times 360^\circ = 108^\circ, \; 0.45 \times 360^\circ = 162^\circ
Multiply the first two shares by 360°.
0.15 \times 360^\circ = 54^\circ, \; 0.10 \times 360^\circ = 36^\circ
Multiply the last two shares by 360°.
108^\circ + 162^\circ + 54^\circ + 36^\circ = 360^\circ
Check the angles fill the circle.
\text{Desmos: } c = [18, 27, 9, 6]Then type c/total(c) and 360c/total(c). On a TI-84, put the counts in L1, then set L2 = L1/sum(L1) and L3 = 360L2.
Answer: 30%, 45%, 15%, 10%; angles 108°, 162°, 54°, 36°
10.
\dfrac{52}{80} = 0.65 = 65\%Juniors who say yes.
\dfrac{35}{70} = 0.50 = 50\%Seniors who say yes.
\text{65\% vs. 50\%}The yes segments would be clearly different heights.
Answer: 65% of juniors and 50% of seniors; the segmented bars differ, so the graph shows an association between grade and answer
Bar graphs and pie charts FAQ
What is the difference between a bar graph and a pie chart?
A bar graph compares categories with bars, so it is best for comparing categories with each other. A pie chart shows each category as a slice of one circle, so it is best for showing parts of a whole.
When should you use a pie chart?
Use a pie chart when the categories don’t overlap, together make up the whole group, and there are only a few of them. If percents add to more than 100%, use a bar graph.
What is the difference between a bar graph and a histogram?
A bar graph shows categorical data, with gaps between the bars. A histogram shows quantitative data grouped into number intervals, so its bars touch along a number line.
How do you find the angle for a pie chart?
Divide the category’s count by the total to get its relative frequency, then multiply by 360°. For example, 9 out of 50 is 0.18, and 0.18 × 360° = 64.8°.
Summary
- A frequency table lists the count for each category; relative frequency is count divided by total.
- Bar graphs compare categories with separated bars on an axis that starts at 0.
- Pie charts show parts of one whole; each slice angle is relative frequency × 360°.
- Compare groups of different sizes with relative frequencies, for example in a segmented bar graph.
- Watch for misleading graphs: axes that don’t start at 0, overlapping categories in a pie chart, and 3D effects.
Previous lesson: Categorical and Quantitative Variables
Next lesson: Stem-and-Leaf Plots
Back to the Statistics Index