
Stem-and-Leaf Plots
A stem-and-leaf plot (or stemplot) shows quantitative data by splitting each value into a stem and a leaf. The stem is every digit except the last, and the leaf is the last digit. Leaves are written in order beside their stem, so the plot shows the shape of the data and keeps every value.
Before this lesson: Categorical and Quantitative Variables, Mean, Median, Mode and Range and Dot Plots and Histograms
What a stem-and-leaf plot shows
A stem-and-leaf plot is a quick way to graph a small set of numbers by hand. For the value 73, the stem is 7 and the leaf is 3. All values in the 70s share the stem 7, so their leaves line up in one row.
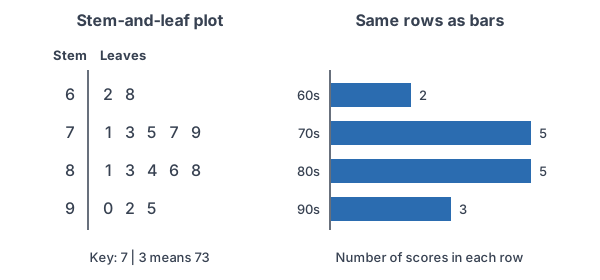
Each row works like a bar. A long row means many values in that interval. Turn the plot on its side and it looks like a histogram, but you can still read every original value. That makes it easy to find the median, the range and any gaps or outliers.
How to make a stem-and-leaf plot
- Choose the stems. For two-digit whole numbers, the stem is the tens digit. For values like 4.6, the stem can be the whole-number part and the leaf the tenths digit.
- List the stems in order from smallest to largest in a column, with a vertical line to their right. Include every stem in the range, even one with no leaves.
- Write each value’s last digit as a leaf beside its stem.
- Put the leaves in each row in order from smallest to largest, evenly spaced.
- Add a key, such as 7 \mid 3 = 73, so readers know what the digits mean.
Split stems: when most values fall on only one or two stems, use each stem twice. The first row holds leaves 0 to 4, and the second holds leaves 5 to 9. Back-to-back plots: to compare two groups, share one column of stems and write one group’s leaves to the left and the other’s to the right.
Stem-and-leaf plot examples
Example 1: Make a stem-and-leaf plot
Fifteen students’ quiz scores are (example data): 62, 75, 81, 68, 90, 77, 84, 73, 88, 95, 79, 71, 86, 83, 92. Make a stem-and-leaf plot.
62, 68, 71, 73, 75, 77, 79, 81, 83, 84, 86, 88, 90, 92, 95
Sort the values from smallest to largest.
\text{Stems: } 6, 7, 8, 9The tens digits run from 6 to 9.
6 \mid 2 \; 8
Write the ones digits of 62 and 68 beside stem 6.
7 \mid 1 \; 3 \; 5 \; 7 \; 9
Write the leaves for 71, 73, 75, 77 and 79.
8 \mid 1 \; 3 \; 4 \; 6 \; 8
Write the leaves for 81, 83, 84, 86 and 88.
9 \mid 0 \; 2 \; 5
Write the leaves for 90, 92 and 95.
2 + 5 + 5 + 3 = 15
Check: the plot has one leaf for each of the 15 scores.
| Stem | Leaves |
|---|---|
| 6 | 2 8 |
| 7 | 1 3 5 7 9 |
| 8 | 1 3 4 6 8 |
| 9 | 0 2 5 |
Answer: the plot above, with the key 7 | 3 = 73. Most scores are in the 70s and 80s.
Example 2: Find the median and range from the plot
Use the stem-and-leaf plot from Example 1 to find the median and the range of the quiz scores.
n = 15
Count the leaves.
\dfrac{n + 1}{2} = \dfrac{15 + 1}{2}The median is the middle value (see mean, median, mode and range). Find its position.
\dfrac{16}{2} = 8The median is the 8th value in order.
2 + 5 = 7
Stems 6 and 7 hold the first 7 values.
\text{8th value} = 8 \mid 1 = 81The 8th value is the first leaf on stem 8.
\text{Range} = 95 - 62Subtract the smallest value (first leaf) from the largest value (last leaf).
\text{Range} = 33Simplify.
On a TI-84: enter the 15 scores in L1 (STAT, 1:Edit), then run STAT, CALC, 1:1-Var Stats. Scroll down to see Med = 81, minX = 62 and maxX = 95. In Desmos: type s = [62, 75, 81, 68, 90, 77, 84, 73, 88, 95, 79, 71, 86, 83, 92], then median(s) shows 81.
Answer: the median is 81 and the range is 33 points.
Example 3: Decimal data
The battery life, in hours, of 12 phones is (example data): 4.2, 3.8, 5.1, 4.7, 4.4, 3.9, 5.0, 4.9, 4.1, 4.6, 5.3, 4.4. Make a stem-and-leaf plot and find the median.
3.8, 3.9, 4.1, 4.2, 4.4, 4.4, 4.6, 4.7, 4.9, 5.0, 5.1, 5.3
Sort the values.
\text{Stem = ones digit, leaf = tenths digit}Every value is between 3 and 6 hours.
3 \mid 8 \; 9
Leaves for 3.8 and 3.9.
4 \mid 1 \; 2 \; 4 \; 4 \; 6 \; 7 \; 9
Leaves for the seven values from 4.1 to 4.9.
5 \mid 0 \; 1 \; 3
Leaves for 5.0, 5.1 and 5.3.
\dfrac{12 + 1}{2} = 6.5With 12 values, the median is halfway between the 6th and 7th values.
\text{6th} = 4.4, \; \text{7th} = 4.6Count leaves: 2 on stem 3, then the 4th and 5th leaves on stem 4.
\dfrac{4.4 + 4.6}{2} = \dfrac{9.0}{2} = 4.5Average the two middle values.
| Stem | Leaves |
|---|---|
| 3 | 8 9 |
| 4 | 1 2 4 4 6 7 9 |
| 5 | 0 1 3 |
Answer: key 4 | 6 = 4.6 hours. The median battery life is 4.5 hours.
Example 4: Split stems
Sixteen commute times, in minutes, are (example data): 20, 22, 23, 24, 25, 25, 26, 27, 28, 29, 31, 31, 32, 34, 36, 41. Make a plot with split stems.
\text{Stems } 2, 3, 4 \text{ would give rows of } 10, 5, 1 \text{ leaves}Two-thirds of the values pile up on stem 2, so split each stem.
2 \mid 0 \; 2 \; 3 \; 4
First row for stem 2: leaves 0 to 4 (20 to 24).
2 \mid 5 \; 5 \; 6 \; 7 \; 8 \; 9
Second row for stem 2: leaves 5 to 9 (25 to 29).
3 \mid 1 \; 1 \; 2 \; 4
First row for stem 3 (30 to 34).
3 \mid 6
Second row for stem 3 (35 to 39).
4 \mid 1
First row for stem 4. No second row is needed after the last value.
4 + 6 + 4 + 1 + 1 = 16
Check: 16 leaves for 16 values.
| Stem | Leaves |
|---|---|
| 2 | 0 2 3 4 |
| 2 | 5 5 6 7 8 9 |
| 3 | 1 1 2 4 |
| 3 | 6 |
| 4 | 1 |
Answer: the split plot shows a peak at 25 to 29 minutes and a tail toward longer commutes, which one row per stem would hide.
Example 5: Compare two classes (word problem)
Two classes take the same test (example data). Class A: 58, 64, 67, 71, 73, 75, 78, 82, 85, 91. Class B: 69, 74, 77, 80, 82, 84, 86, 88, 93, 97. Make a back-to-back stem-and-leaf plot, and compare the medians and ranges.
| Class A leaves | Stem | Class B leaves |
|---|---|---|
| 8 | 5 | |
| 7 4 | 6 | 9 |
| 8 5 3 1 | 7 | 4 7 |
| 5 2 | 8 | 0 2 4 6 8 |
| 1 | 9 | 3 7 |
Class A’s leaves are written to the left of the stem, but each one still goes after its stem: leaf 4 on stem 6 means 64.
\text{A median} = \dfrac{73 + 75}{2} = 74Class A has 10 scores, so average the 5th and 6th values.
\text{B median} = \dfrac{82 + 84}{2} = 83Average Class B’s 5th and 6th values.
\text{A range} = 91 - 58 = 33Largest minus smallest for Class A.
\text{B range} = 97 - 69 = 28Largest minus smallest for Class B.
Answer: Class B did better (median 83 vs. 74), and its scores are a little less spread out (range 28 vs. 33).
Common mistakes
| Mistake | Example of the error | Fix |
|---|---|---|
| Leaving out the key | A plot of times with no key, so 4 | 6 could mean 46 or 4.6 | Always add a key, such as 4 | 6 = 4.6 hours. |
| Not ordering the leaves | 7 | 5 1 9 3 7 | Sort each row: 7 | 1 3 5 7 9. Ordered leaves make the median easy to find. |
| Skipping an empty stem | Values 22, 25 and 46 plotted with stems 2 and 4 only | List stems 2, 3 and 4, and leave row 3 empty to show the gap. |
| Using two-digit leaves | 8 | 12 for 812 | A leaf is one digit. Use stem 81 and leaf 2. |
| Uneven spacing of leaves | Crowding some leaves and spreading others | Space every leaf the same, so row lengths compare like bars. |
| Reading the left side of a back-to-back plot backward | Reading leaf 4 on the left of stem 6 as 46 | A left-side leaf still goes after its stem: leaf 4 on stem 6 means 64. |
Related methods
Stemplots, dot plots and histograms
A stem-and-leaf plot keeps every value, which works well for about 15 to 50 values. For larger data sets, a histogram is easier to draw. To summarize the five-number summary, use a box plot.
Choosing a graph by variable type
Stemplots are for quantitative data only. For categorical data, use bar graphs and pie charts. To describe what a stemplot shows (shape, center, spread and outliers), see describing a distribution, the topic of the next lesson.
Practice problems
- Make a stem-and-leaf plot of these values: 34, 47, 52, 38, 45, 41, 56, 33, 49, 50.
- A stemplot has rows 1 | 2 5 8, 2 | 0 3 3 7 and 3 | 1 4, with key 2 | 3 = 23. List the values, and find the median, mode and range.
- In one plot the key is 6 | 4 = 6.4; in another it is 6 | 4 = 640. What value does 6 | 4 stand for in each?
- Make a stemplot of 11, 14, 17, 22, 25, 46. Which stem has no leaves, and what does the gap show?
- Find the mean of the data in Problem 2. Round to the nearest tenth.
- Make a stemplot of 2.3, 2.8, 3.1, 3.4, 3.4, 3.9, 4.0, and find the median.
- Make a split-stem plot of 40, 41, 43, 44, 45, 46, 47, 47, 48, 49, 51, 52, and find the median.
- In a back-to-back plot with stems 1, 2 and 3, Team A’s values are 13, 21, 24, 29, 32 and Team B’s values are 15, 18, 26, 33, 35. Find each team’s median.
- Make a stemplot of 112, 118, 125, 131, 134. What are the stems and the key?
- A stemplot has rows 1 | 1 2 2 3 4 5, 2 | 0 1 3 6, 3 | 2 5, 4 | 1 and 5 | 8, with key 2 | 3 = 23. Which row is longest, and is any value far from the rest?
Show answers
1.
33, 34, 38, 41, 45, 47, 49, 50, 52, 56
Sort the values.
3 \mid 3 \; 4 \; 8
Leaves for 33, 34 and 38.
4 \mid 1 \; 5 \; 7 \; 9
Leaves for 41, 45, 47 and 49.
5 \mid 0 \; 2 \; 6
Leaves for 50, 52 and 56.
Answer: 3 | 3 4 8, 4 | 1 5 7 9, 5 | 0 2 6, with key 4 | 1 = 41
2.
12, 15, 18, 20, 23, 23, 27, 31, 34
Read each stem with each of its leaves.
\dfrac{9 + 1}{2} = 5With 9 values, the median is the 5th value.
\text{Median} = 23The 5th value is 23.
\text{Mode} = 2323 is the only value that appears twice.
\text{Range} = 34 - 12 = 22Largest minus smallest.
Answer: median 23, mode 23, range 22
3.
6 \mid 4 = 6.4
With the first key, the leaf is the tenths digit.
6 \mid 4 = 640
With the second key, the stem is hundreds and the leaf is tens.
Answer: 6.4 in the first plot and 640 in the second; the key decides
4.
1 \mid 1 \; 4 \; 7, \; 2 \mid 2 \; 5
Write the leaves for the values in the teens and 20s.
3 \mid \;
Stem 3 has no leaves, but it stays in the plot.
4 \mid 6
Leaf for 46.
Answer: stem 3 is empty; the gap shows that 46 is far from the other values, so it may be an outlier
5.
12 + 15 + 18 + 20 + 23 + 23 + 27 + 31 + 34 = 203
Add the 9 values.
\bar{x} = \dfrac{203}{9} \approx 22.6Divide by n = 9 and round.
Answer: about 22.6
6.
2 \mid 3 \; 8, \; 3 \mid 1 \; 4 \; 4 \; 9, \; 4 \mid 0
Stems are ones digits; leaves are tenths digits.
\dfrac{7 + 1}{2} = 4With 7 values, the median is the 4th value.
\text{4th value} = 3.4Two leaves on stem 2, then the 2nd leaf on stem 3.
Answer: median 3.4, with key 3 | 4 = 3.4
7.
4 \mid 0 \; 1 \; 3 \; 4
First row for stem 4: leaves 0 to 4.
4 \mid 5 \; 6 \; 7 \; 7 \; 8 \; 9
Second row for stem 4: leaves 5 to 9.
5 \mid 1 \; 2
First row for stem 5.
\text{6th} = 46, \; \text{7th} = 47With 12 values, the median is between the 6th and 7th values.
\dfrac{46 + 47}{2} = 46.5Average them.
Answer: median 46.5
8.
\text{A: } 13, 21, \mathbf{24}, 29, 32Team A’s middle (3rd) value is 24.
\text{B: } 15, 18, \mathbf{26}, 33, 35Team B’s middle (3rd) value is 26.
Answer: Team A’s median is 24 and Team B’s is 26
9.
\text{Stems: } 11, 12, 13Use every digit except the last as the stem.
11 \mid 2 \; 8, \; 12 \mid 5, \; 13 \mid 1 \; 4
The ones digits are the leaves.
Answer: stems 11, 12, 13; key 12 | 5 = 125
10.
\text{Row 1 has 6 leaves}Rows have 6, 4, 2, 1 and 1 leaves, so the 10s row is longest.
58 - 41 = 17
The largest value, 58, sits 17 above the next largest value, 41.
Answer: the 10s row is longest; the values trail off toward larger numbers, and 58 is far from the rest (a possible outlier)
Stem-and-leaf plots FAQ
How do you read a stem-and-leaf plot?
Put each leaf after its stem to rebuild a value, using the key. With the key 7 | 3 = 73, the row 7 | 1 3 5 stands for 71, 73 and 75.
What is the key in a stem-and-leaf plot?
The key tells what one stem and leaf mean, such as 4 | 6 = 4.6 hours. Without it, a reader can’t tell 46 from 4.6 or 460.
How do you find the median from a stem-and-leaf plot?
Count the leaves to get n, then count through the ordered leaves to the middle position, (n + 1) ÷ 2. If n is even, average the two middle values.
What is the difference between a stem-and-leaf plot and a histogram?
Both show the shape of quantitative data. A stem-and-leaf plot keeps every original value, while a histogram only shows how many values fall in each interval.
Summary
- Split each value into a stem (all but the last digit) and a leaf (the last digit).
- List every stem in order, sort the leaves in each row, and always include a key.
- Read the median and range straight from the ordered leaves.
- Use split stems when the data crowd onto a few stems, and back-to-back plots to compare two groups.
- A stemplot is a histogram on its side that keeps every value.
Previous lesson: Bar Graphs and Pie Charts
Next lesson: Describing a Distribution
Back to the Statistics Index