
Riemann Sums
A Riemann sum estimates the area under a curve by adding up the areas of rectangles. Split [a, b] into n equal pieces of width \Delta x = \frac{b - a}{n}, make a rectangle on each piece whose height is the function’s value at the left endpoint, right endpoint or midpoint, and add the areas: width × height for each rectangle.
Before this lesson: Antiderivatives and Indefinite Integrals, Sigma Notation and Area of Rectangles
Why rectangles?
The area under a curve has curved edges, so there is no simple formula for it. Rectangles are easy: their area is base times height. If you cover the region with thin rectangles, the total of their areas is close to the true area, and using more, thinner rectangles makes the estimate better.
Riemann sum formulas
| Sum | Sample points | Formula with \Delta x = \frac{b - a}{n} |
|---|---|---|
| Left (Lₙ) | Left endpoints x_0, \ldots, x_{n-1} | \Delta x\,[f(x_0) + f(x_1) + \cdots + f(x_{n-1})] |
| Right (Rₙ) | Right endpoints x_1, \ldots, x_n | \Delta x\,[f(x_1) + f(x_2) + \cdots + f(x_n)] |
| Midpoint (Mₙ) | Midpoints of each piece | \Delta x\,[f(m_1) + f(m_2) + \cdots + f(m_n)] |
Here x_i = a + i\,\Delta x. In sigma notation, the right sum is R_n = \sum_{i=1}^{n} f(a + i\,\Delta x)\,\Delta x.
Over or under? For an increasing function, left sums are too small and right sums are too big. For a decreasing function, it is the other way around. The midpoint sum is usually the most accurate of the three.
Riemann sum examples
Example 1: Left Riemann sum
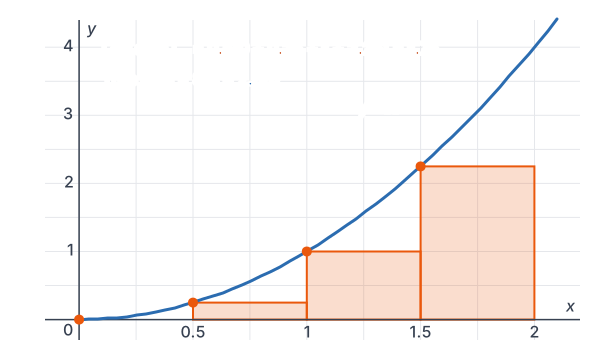
Estimate the area under f(x) = x^2 on [0, 2] with a left sum and n = 4.
\Delta x = \frac{2 - 0}{4} = 0.5Width of each rectangle.
x = 0, \; 0.5, \; 1, \; 1.5
Left endpoints.
f(0) + f(0.5) + f(1) + f(1.5) = 0 + 0.25 + 1 + 2.25 = 3.5
Add the heights.
L_4 = 0.5(3.5) = 1.75
Multiply by the width.
Answer: L₄ = 1.75, an underestimate, since x² is increasing on [0, 2].
Example 2: Right Riemann sum
Estimate the same area with a right sum and n = 4.
x = 0.5, \; 1, \; 1.5, \; 2
Right endpoints.
f(0.5) + f(1) + f(1.5) + f(2) = 0.25 + 1 + 2.25 + 4 = 7.5
Add the heights.
R_4 = 0.5(7.5) = 3.75
Multiply by the width.
Answer: R₄ = 3.75, an overestimate. The true area, 8/3 ≈ 2.667, is between L₄ and R₄.
Example 3: Midpoint Riemann sum
Estimate the same area with a midpoint sum and n = 4.
m = 0.25, \; 0.75, \; 1.25, \; 1.75
Midpoints of the four pieces.
0.0625 + 0.5625 + 1.5625 + 3.0625 = 5.25
Square each midpoint and add.
M_4 = 0.5(5.25) = 2.625
Multiply by the width.
Answer: M₄ = 2.625, within 0.042 of the true area 2.667. That is much closer than either the left or the right sum.
Example 4: Word problem with a table of velocities
A car’s speed is recorded every 10 seconds. Estimate the distance it travels in 40 seconds with a left sum and a right sum.
| t (s) | 0 | 10 | 20 | 30 | 40 |
|---|---|---|---|---|---|
| v(t) (m/s) | 0 | 12 | 20 | 25 | 28 |
\Delta t = 10
The readings are 10 s apart.
L_4 = 10(0 + 12 + 20 + 25) = 10(57) = 570
Left sum: use the first four speeds.
R_4 = 10(12 + 20 + 25 + 28) = 10(85) = 850
Right sum: use the last four speeds.
Answer: the car travels between about 570 m and 850 m. Distance is the area under a velocity graph, because each rectangle is speed × time. The speed is increasing, so 570 m is too low and 850 m is too high.
Example 5: A right sum in sigma notation
Write the right sum for f(x) = \frac{1}{x} on [1, 3] with n = 4 in sigma notation, then evaluate it.
\Delta x = \frac{3 - 1}{4} = 0.5Width.
R_4 = \sum_{i=1}^{4} f(1 + 0.5i)(0.5)The right endpoints are 1 + 0.5i for i = 1 to 4.
f(1.5) + f(2) + f(2.5) + f(3) \approx 0.6667 + 0.5 + 0.4 + 0.3333 = 1.9
Evaluate 1/x at 1.5, 2, 2.5 and 3.
R_4 = 0.5(1.9) = 0.95
Multiply by the width.
Answer: R₄ = 0.95. Since 1/x is decreasing, this is an underestimate. (The true area is ln 3 ≈ 1.0986.)
Common mistakes
| Mistake | Example of the error | Fix |
|---|---|---|
| Forgetting to multiply by Δx | Giving 3.5 as L₄ in Example 1 | Each term is height × width: 0.5(3.5) = 1.75. |
| Using n + 1 points | Adding f(0) through f(2) for a left sum with n = 4 | A left sum uses x₀ to xₙ₋₁: exactly n heights. |
| Using endpoints for a midpoint sum | Using x = 0.5, 1, 1.5, 2 for M₄ | Midpoints are halfway: 0.25, 0.75, 1.25, 1.75. |
| Mixing up over and under | Calling a left sum too big for an increasing function | Left sums under-estimate increasing functions. |
| Using unequal widths from a table as if equal | Using Δt = 10 when readings are 5 and 15 s apart | Multiply each height by its own width. |
Related methods
Trapezoids
Averaging the left and right sums is the same as using trapezoids instead of rectangles. That is the trapezoidal rule, the next lesson, and it is usually more accurate than Lₙ or Rₙ.
The limit of Riemann sums
As n → ∞, the rectangles get thinner and the sums close in on the exact area. That limit is the definite integral, \int_a^b f(x)\,dx, coming up in this unit.
Practice problems
- Find the left sum for f(x) = x on [0, 4] with n = 4.
- Find the right sum for f(x) = x on [0, 4] with n = 4.
- Find the midpoint sum for f(x) = x^2 on [0, 4] with n = 2.
- Find the left sum for f(x) = x^3 on [0, 2] with n = 4.
- Find the right sum for f(x) = \frac{1}{x} on [1, 2] with n = 2.
- Find the right sum for f(x) = \sqrt{x} on [0, 9] with n = 3. Is it over or under the true area?
- Find the left sum for f(x) = 4 - x^2 on [0, 2] with n = 2. Is it over or under?
- Write the right sum for f(x) = x^2 on [0, 3] with n = 6 in sigma notation and evaluate it.
- Water flows into a tank at r(t) gallons per minute: r(0) = 5, r(2) = 8, r(4) = 9, r(6) = 7. Estimate the water added from t = 0 to t = 6 with left and right sums.
- Find the midpoint sum for f(x) = sin x on [0, π] with n = 2.
Show answers
1.
\Delta x = 1; \; 0 + 1 + 2 + 3 = 6
Left endpoints 0, 1, 2, 3.
L_4 = 1(6) = 6
Multiply by the width.
Answer: 6
2.
1 + 2 + 3 + 4 = 10
Right endpoints 1, 2, 3, 4.
R_4 = 1(10) = 10
Multiply by Δx = 1.
Answer: 10 (the true area is 8)
3.
\Delta x = 2; \; m = 1, \; 3
Two pieces, [0, 2] and [2, 4].
M_2 = 2(1 + 9) = 20
1² + 3² = 10, times the width 2.
Answer: 20 (the true area is 64/3 ≈ 21.33)
4.
\Delta x = 0.5; \; 0 + 0.125 + 1 + 3.375 = 4.5
Cubes of 0, 0.5, 1 and 1.5.
L_4 = 0.5(4.5) = 2.25
Multiply by the width.
Answer: 2.25 (the true area is 4)
5.
\Delta x = 0.5; \; \frac{1}{1.5} + \frac{1}{2} \approx 0.6667 + 0.5 = 1.1667Right endpoints 1.5 and 2.
R_2 = 0.5(1.1667) \approx 0.5833
Multiply by the width.
Answer: about 0.583
6.
\Delta x = 3; \; \sqrt{3} + \sqrt{6} + \sqrt{9} \approx 1.732 + 2.449 + 3 = 7.181Right endpoints 3, 6, 9.
R_3 = 3(7.181) \approx 21.54
Multiply by the width.
Answer: about 21.54, an overestimate, since √x is increasing (the true area is 18)
7.
\Delta x = 1; \; f(0) + f(1) = 4 + 3 = 7
Left endpoints 0 and 1.
L_2 = 1(7) = 7
Multiply by the width.
Answer: 7, an overestimate, since 4 − x² is decreasing on [0, 2] (the true area is 16/3 ≈ 5.33)
8.
R_6 = \sum_{i=1}^{6} (0.5i)^2(0.5)Δx = 0.5 and the right endpoints are 0.5i.
R_6 = 0.125\sum_{i=1}^{6} i^2 = 0.125(91)(0.5i)²(0.5) = 0.125i², and 1 + 4 + 9 + 16 + 25 + 36 = 91.
R_6 = 11.375
Multiply.
Answer: 11.375 (the true area is 9)
9.
L_3 = 2(5 + 8 + 9) = 44
Left sum with Δt = 2.
R_3 = 2(8 + 9 + 7) = 48
Right sum.
Answer: about 44 to 48 gallons
10.
\Delta x = \frac{\pi}{2}; \; m = \frac{\pi}{4}, \; \frac{3\pi}{4}Two pieces of width π/2.
M_2 = \frac{\pi}{2}\left(\frac{\sqrt{2}}{2} + \frac{\sqrt{2}}{2}\right) = \frac{\pi\sqrt{2}}{2} \approx 2.221sin(π/4) = sin(3π/4) = √2/2.
Answer: about 2.221 (the true area is 2)
Riemann sums FAQ
What is a Riemann sum?
A sum of rectangle areas, Δx times a function value on each piece, that estimates the area under a curve.
What is the difference between left, right and midpoint Riemann sums?
They use different points for the rectangle heights: the left end, the right end or the middle of each piece.
When is a left Riemann sum an overestimate?
When the function is decreasing. Each rectangle uses the highest point of its piece, so it sticks out above the curve.
How do you make a Riemann sum more accurate?
Use more rectangles (a larger n), or use midpoints or trapezoids, which usually balance out the errors.
Summary
- \Delta x = \frac{b - a}{n}; each rectangle’s area is height × Δx.
- Left, right and midpoint sums use different sample points.
- Increasing function: left under, right over. Decreasing: the reverse.
- Midpoint sums are usually the most accurate.
- More rectangles give better estimates; the limit is the definite integral.
Previous lesson: Antiderivatives and Indefinite Integrals
Next lesson: Trapezoidal Rule
Back to the Calculus 1 Index