
Outliers and the 1.5 × IQR Rule
The 1.5 × IQR rule is the standard way to find outliers. Find the interquartile range, IQR = Q3 − Q1, and multiply it by 1.5. Any value below Q1 − 1.5 × IQR or above Q3 + 1.5 × IQR is an outlier. These two cutoffs are called the lower and upper fences.
Before this lesson: Box Plots, Describing a Distribution and Standard Deviation
What makes a value an outlier
An outlier is a value that falls far outside the overall pattern of the data. Looking at a graph is a good start, but people can disagree about what “far” means. The 1.5 × IQR rule gives everyone the same test.
The rule measures distance in IQRs. The IQR is the width of the middle half of the data, so a value more than one and a half IQRs past the box is unusually far out. Because the quartiles are resistant, the outliers themselves don’t change the fences much.
The 1.5 × IQR rule
\text{IQR} = Q_3 - Q_1\text{Lower fence} = Q_1 - 1.5 \times \text{IQR} \qquad \text{Upper fence} = Q_3 + 1.5 \times \text{IQR}- Put the data in order and find the median.
- Find Q1, the median of the lower half, and Q3, the median of the upper half. (When n is odd, leave the median out of both halves.)
- Find the IQR = Q3 − Q1, then 1.5 × IQR.
- Find the fences: subtract 1.5 × IQR from Q1 and add it to Q3.
- Any value below the lower fence or above the upper fence is an outlier.
Outlier examples
Example 1: An outlier on the high side
Find any outliers in these 11 values (example data): 12, 15, 17, 18, 19, 20, 21, 22, 24, 25, 41.
\text{Median} = 20The data are in order; the median is the 6th of 11 values.
Q_1 = 17
Median of the lower half 12, 15, 17, 18, 19 (see box plots).
Q_3 = 24
Median of the upper half 21, 22, 24, 25, 41.
\text{IQR} = 24 - 17 = 7Subtract Q1 from Q3.
1.5 \times 7 = 10.5
Multiply the IQR by 1.5.
17 - 10.5 = 6.5
Lower fence: subtract from Q1.
24 + 10.5 = 34.5
Upper fence: add to Q3.
41 \gt 34.5
Compare the extreme values with the fences. 12 is above 6.5, but 41 is above 34.5.
Answer: 41 is an outlier. No value is below the lower fence.
Example 2: An outlier on the low side
Find any outliers in these 10 values (example data): 3, 28, 31, 33, 34, 36, 37, 39, 40, 42.
\text{Median} = \dfrac{34 + 36}{2} = 35With 10 values, average the 5th and 6th.
Q_1 = 31
Median of the lower half 3, 28, 31, 33, 34.
Q_3 = 39
Median of the upper half 36, 37, 39, 40, 42.
\text{IQR} = 39 - 31 = 8Subtract.
1.5 \times 8 = 12
Multiply by 1.5.
31 - 12 = 19, \; 39 + 12 = 51
Find the lower and upper fences.
3 \lt 19
3 is below the lower fence; 42 is below the upper fence.
Answer: 3 is an outlier.
Example 3: A value that looks far but isn’t an outlier
Do these 8 values have an outlier (example data)? 5, 8, 9, 10, 12, 14, 15, 22.
Q_1 = \dfrac{8 + 9}{2} = 8.5The lower half is 5, 8, 9, 10; average its middle two.
Q_3 = \dfrac{14 + 15}{2} = 14.5The upper half is 12, 14, 15, 22; average its middle two.
\text{IQR} = 14.5 - 8.5 = 6Subtract.
1.5 \times 6 = 9
Multiply by 1.5.
8.5 - 9 = -0.5, \; 14.5 + 9 = 23.5
Find the fences.
22 \lt 23.5
The largest value is inside the upper fence.
Answer: no outliers. 22 is 7 above the next value, but it is still within the fences, so the rule does not flag it.
Example 4: Screen time and a modified box plot (word problem)
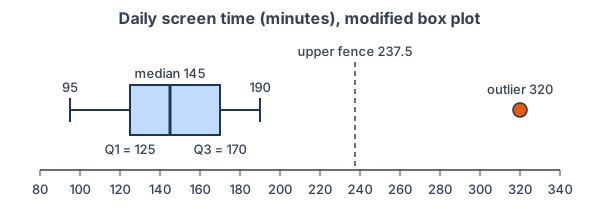
Fifteen teens record their daily screen time in minutes (example data): 95, 110, 120, 125, 130, 135, 140, 145, 150, 155, 160, 170, 180, 190, 320. Find any outliers and describe the modified box plot.
\text{Median} = 145The 8th of 15 ordered values.
Q_1 = 125
Median of the lower 7 values, 95 to 140.
Q_3 = 170
Median of the upper 7 values, 150 to 320.
\text{IQR} = 170 - 125 = 45Subtract.
1.5 \times 45 = 67.5
Multiply by 1.5.
125 - 67.5 = 57.5, \; 170 + 67.5 = 237.5
Find the fences.
320 \gt 237.5
320 is above the upper fence; 95 is above the lower fence.
On a TI-84: enter the data in L1, then STAT, CALC, 1:1-Var Stats to see Q1 = 125, Med = 145 and Q3 = 170. For the graph, press 2nd, STAT PLOT, turn Plot1 on, and choose the first box-plot icon (the one with separate dots). ZOOM, 9:ZoomStat draws it; TRACE shows the outlier at 320. In Desmos: type s = [95, 110, 120, 125, 130, 135, 140, 145, 150, 155, 160, 170, 180, 190, 320], then boxplot(s). Some software finds quartiles a slightly different way, so its Q1 and Q3 can differ a little from hand values.
Answer: 320 minutes is an outlier. In the modified box plot (shown above), the box runs from 125 to 170, the whiskers reach 95 and 190 (the most extreme values inside the fences), and 320 is a separate dot.
Example 5: How an outlier affects the summary
Use the data from Example 2. Compare the mean and median with and without the outlier, 3.
3 + 28 + 31 + 33 + 34 + 36 + 37 + 39 + 40 + 42 = 323
Add all 10 values.
\bar{x} = \dfrac{323}{10} = 32.3Mean with the outlier.
323 - 3 = 320
Remove the outlier from the sum.
\bar{x} = \dfrac{320}{9} \approx 35.6Mean of the other 9 values.
\text{Median without 3} = 36The 5th of the 9 remaining values.
Answer: removing 3 moves the mean by about 3.3 (32.3 to 35.6) but the median by only 1 (35 to 36). The median is resistant. Never delete an outlier just because it is unusual: check whether it is a mistake, and report the median and IQR if it is real.
Common mistakes
| Mistake | Example of the error | Fix |
|---|---|---|
| Using the median instead of the quartiles | Finding fences as 20 ± 10.5 in Example 1 | Subtract from Q1 and add to Q3, not the median. |
| Forgetting to multiply by 1.5 | Using fences 17 − 7 and 24 + 7 | Multiply the IQR by 1.5 first: 1.5 × 7 = 10.5. |
| Calling the fences outliers | “The outlier is 34.5.” | The fences are cutoffs. The outliers are data values beyond them, like 41. |
| Drawing whiskers to the fences | A whisker ending at 237.5 in Example 4 | Whiskers end at the most extreme data values inside the fences (95 and 190). |
| Checking only one side | Testing only the largest value | Check both the smallest and largest values against both fences. |
| Deleting outliers automatically | Dropping 320 minutes because it is “too high” | Find out why it is unusual. Remove it only if it is an error. |
Related methods
Other outlier rules
For roughly symmetric data, some people flag values more than 2 standard deviations from the mean, using the standard deviation. The 1.5 × IQR rule works for any shape, because it does not use the mean. Values beyond 3 × IQR from the box are sometimes called extreme outliers.
Outliers in a full description
An outlier is the “O” in SOCS, so mention it whenever you describe a distribution. Percentiles and z-scores, the next lesson, give another way to say how unusual a value is.
Practice problems
- A data set has Q1 = 20 and Q3 = 30. Find the lower and upper fences.
- A data set has Q1 = 40 and Q3 = 52. Is 75 an outlier?
- Find any outliers: 2, 4, 5, 6, 7, 8, 9, 30.
- Find any outliers: 1, 20, 22, 23, 25, 26, 27.
- Find any outliers: 10, 12, 13, 15, 16, 18, 20.
- A five-number summary is min = 4, Q1 = 10, median = 14, Q3 = 18, max = 35. Is the minimum an outlier? Is the maximum?
- A data set has mean 50 and standard deviation 6. Is 64 more than 2 standard deviations from the mean?
- A survey of hourly pay at a store includes one value of $250 per hour. What should you do before removing it?
- Find any outliers: 15, 48, 50, 51, 53, 54, 55, 57, 58, 90.
- For 4, 5, 6, 7, 28, find the mean and median with and without 28.
Show answers
1.
\text{IQR} = 30 - 20 = 10Subtract Q1 from Q3.
1.5 \times 10 = 15
Multiply by 1.5.
20 - 15 = 5, \; 30 + 15 = 45
Subtract from Q1 and add to Q3.
Answer: lower fence 5, upper fence 45
2.
\text{IQR} = 52 - 40 = 12Subtract.
1.5 \times 12 = 18
Multiply by 1.5.
52 + 18 = 70
Upper fence.
75 \gt 70
Compare.
Answer: yes, 75 is above the upper fence of 70
3.
Q_1 = \dfrac{4 + 5}{2} = 4.5, \; Q_3 = \dfrac{8 + 9}{2} = 8.5Halves: 2, 4, 5, 6 and 7, 8, 9, 30.
\text{IQR} = 8.5 - 4.5 = 4Subtract.
1.5 \times 4 = 6
Multiply by 1.5.
4.5 - 6 = -1.5, \; 8.5 + 6 = 14.5
Find the fences.
30 \gt 14.5
Compare the largest value.
Answer: 30 is an outlier
4.
Q_1 = 20, \; Q_3 = 26
The median is 23; the halves are 1, 20, 22 and 25, 26, 27.
\text{IQR} = 26 - 20 = 6Subtract.
1.5 \times 6 = 9
Multiply by 1.5.
20 - 9 = 11, \; 26 + 9 = 35
Find the fences.
1 \lt 11
Compare the smallest value.
Answer: 1 is an outlier
5.
Q_1 = 12, \; Q_3 = 18
The median is 15; the halves are 10, 12, 13 and 16, 18, 20.
\text{IQR} = 18 - 12 = 6Subtract.
12 - 9 = 3, \; 18 + 9 = 27
Fences, using 1.5 × 6 = 9.
3 \lt 10, \; 20 \lt 27
Both extremes are inside the fences.
Answer: no outliers
6.
\text{IQR} = 18 - 10 = 8Subtract.
1.5 \times 8 = 12
Multiply by 1.5.
10 - 12 = -2, \; 18 + 12 = 30
Find the fences.
4 \gt -2, \; 35 \gt 30
Compare the minimum and maximum.
Answer: the minimum is not an outlier; the maximum, 35, is
7.
50 + 2(6) = 62
Two standard deviations above the mean.
64 \gt 62
Compare.
Answer: yes, 64 is more than 2 standard deviations above the mean
8.
\text{Check the source}Find out whether $250 is a typing error (such as $25.0) or a real value.
Answer: investigate it first; remove or fix it only if it is an error, and otherwise keep it and use resistant measures like the median and IQR
9.
\text{Median} = \dfrac{53 + 54}{2} = 53.5Average the 5th and 6th of 10 values.
Q_1 = 50, \; Q_3 = 57
Halves: 15, 48, 50, 51, 53 and 54, 55, 57, 58, 90.
\text{IQR} = 57 - 50 = 7Subtract.
1.5 \times 7 = 10.5
Multiply by 1.5.
50 - 10.5 = 39.5, \; 57 + 10.5 = 67.5
Find the fences.
15 \lt 39.5, \; 90 \gt 67.5
Compare both extremes.
Answer: 15 and 90 are both outliers
10.
\bar{x} = \dfrac{4 + 5 + 6 + 7 + 28}{5} = \dfrac{50}{5} = 10Mean with 28.
\text{Median} = 6Middle of 5 values.
\bar{x} = \dfrac{4 + 5 + 6 + 7}{4} = \dfrac{22}{4} = 5.5Mean without 28.
\text{Median} = \dfrac{5 + 6}{2} = 5.5Average the two middle values of 4.
Answer: the mean drops from 10 to 5.5, while the median only drops from 6 to 5.5
Outliers and the 1.5 × IQR rule FAQ
What is the 1.5 IQR rule?
It says a value is an outlier if it is more than 1.5 × IQR below Q1 or more than 1.5 × IQR above Q3. The cutoffs Q1 − 1.5 × IQR and Q3 + 1.5 × IQR are called fences.
How do you find outliers in a data set?
Find Q1, Q3 and the IQR, then compute the fences. Check the smallest and largest values: any value outside the fences is an outlier.
What is a modified box plot?
It is a box plot that shows outliers as separate dots. Its whiskers stop at the most extreme values that are still inside the fences.
Should you remove outliers?
Not automatically. Remove or correct an outlier only if it is a mistake, such as a typing error. A real outlier is part of the data, so keep it and use resistant measures like the median and IQR.
Summary
- IQR = Q3 − Q1.
- Fences: Q1 − 1.5 × IQR and Q3 + 1.5 × IQR.
- A value below the lower fence or above the upper fence is an outlier.
- A modified box plot shows outliers as dots, with whiskers to the last values inside the fences.
- Investigate outliers before removing them; the median and IQR resist them, the mean and standard deviation do not.
Previous lesson: Standard Deviation
Next lesson: Percentiles and Z-Scores
Back to the Statistics Index