
Percentiles and Z-Scores
A percentile tells what percent of the data are at or below a value: the 75th percentile is greater than or equal to 75% of the data. A z-score tells how many standard deviations a value is from the mean: z = \dfrac{x - \bar{x}}{s}. Both describe where one value stands in a distribution.
Before this lesson: Standard Deviation, Box Plots and Percentages
What percentiles and z-scores tell you
A raw score like 84 points means little by itself. Was the test easy or hard? Did most people score higher or lower? Percentiles and z-scores answer that by comparing a value with the rest of the data.
A percentile uses position: count how many values are at or below yours. A z-score uses distance: measure how far you are from the mean, in standard deviations. A z-score above 0 means above the mean; below 0 means below the mean.
Percentile and z-score formulas
\text{Percentile of } x = \dfrac{\text{number of values at or below } x}{\text{total number of values}} \times 100z = \dfrac{x - \bar{x}}{s} \qquad x = \bar{x} + z \cdot sUse \mu and \sigma in place of \bar{x} and s for a whole population. Some books count only the values below x for a percentile; on large data sets the two methods give nearly the same answer. The quartiles are percentiles too: Q1 is the 25th, the median is the 50th and Q3 is the 75th.
Percentiles and z-scores examples
Example 1: Find a percentile
Twenty students took a quiz (example data): 58, 62, 65, 68, 70, 72, 74, 75, 77, 78, 80, 81, 83, 84, 85, 88, 90, 92, 95, 98. What percentile is a score of 85?
58, 62, \ldots, 84, 85 \text{ are positions } 1 \text{ to } 15The data are in order. Count the scores at or below 85.
\dfrac{15}{20} = 0.75Divide by the total number of scores.
0.75 \times 100 = 75
Change to a percent (see percentages).
On a TI-84: put unsorted data in L1, then STAT, 2:SortA(L1) sorts it so you can count. In Desmos: type the list as q = [58, 62, 65, ...]; sort(q) puts it in order.
Answer: a score of 85 is at the 75th percentile. It is greater than or equal to 75% of the scores.
Example 2: Find a z-score
Scores on a test have mean 70 and standard deviation 8. Find the z-scores for 82 and for 62.
z = \dfrac{82 - 70}{8}Subtract the mean from the value, then divide by the standard deviation.
z = \dfrac{12}{8} = 1.5Simplify.
z = \dfrac{62 - 70}{8} = \dfrac{-8}{8}Do the same for 62.
z = -1
Simplify (see dividing integers).
Answer: 82 has z = 1.5 (1.5 standard deviations above the mean), and 62 has z = −1 (1 standard deviation below).
Example 3: Compare scores on different tests (word problem)
Maya scored 84 on a history test, where the class mean was 76 and the standard deviation was 5. She scored 90 on a math test, where the mean was 82 and the standard deviation was 8. On which test did she do better compared with her class?
z_{\text{history}} = \dfrac{84 - 76}{5} = \dfrac{8}{5} = 1.6Find the z-score for history.
z_{\text{math}} = \dfrac{90 - 82}{8} = \dfrac{8}{8} = 1.0Find the z-score for math.
1.6 \gt 1.0
Compare the z-scores, not the raw scores.
Answer: history. Both scores are 8 points above the class mean, but 8 points is 1.6 standard deviations in history and only 1 standard deviation in math.
Example 4: Find a value from a z-score
Adult heights in a group have mean 64 inches and standard deviation 2.5 inches. What height has z = −2? What height has z = 1.2?
x = \bar{x} + z \cdot sSolve the z-score formula for x.
x = 64 + (-2)(2.5)
Substitute z = −2.
x = 64 - 5 = 59
Multiply, then add.
x = 64 + (1.2)(2.5)
Substitute z = 1.2.
x = 64 + 3 = 67
Multiply, then add.
Answer: z = −2 is 59 inches, and z = 1.2 is 67 inches.
Example 5: Read a cumulative relative frequency graph
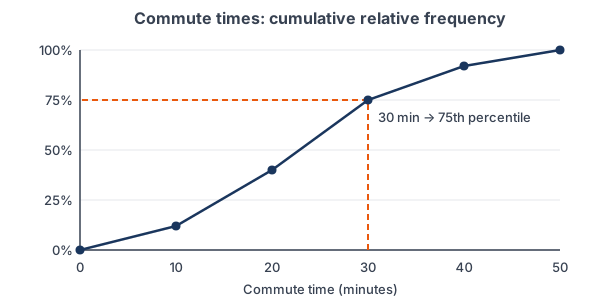
The graph above shows commute times for a large group of workers (example data). The points are (10, 12%), (20, 40%), (30, 75%), (40, 92%) and (50, 100%). What percentile is a 30-minute commute? What percent of commutes are longer than 40 minutes? Between which times is Q1?
30 \text{ min} \rightarrow 75\%Read up from 30 to the graph, then across: 75% of commutes are 30 minutes or less.
100\% - 92\% = 8\%
92% are 40 minutes or less, so the rest are longer.
12\% \lt 25\% \lt 40\%
The 25th percentile falls between the points for 10 and 20 minutes.
Answer: a 30-minute commute is at the 75th percentile, 8% of commutes are longer than 40 minutes, and Q1 is between 10 and 20 minutes.
Common mistakes
| Mistake | Example of the error | Fix |
|---|---|---|
| Subtracting in the wrong order | z = \tfrac{70 - 82}{8} = -1.5 for a score of 82 | Always use value minus mean: \tfrac{82 - 70}{8} = 1.5. |
| Dividing by the variance | Using s^2 = 64 instead of s = 8 | Divide by the standard deviation. |
| Mixing up percent correct and percentile | “I got 70% right, so I’m at the 70th percentile.” | A percentile compares you with others. 70% correct could be the 90th percentile on a hard test. |
| Comparing raw scores across different tests | “90 in math beats 84 in history.” | Compare z-scores, which account for each test’s mean and spread. |
| Thinking a negative z-score is an error | “z can’t be −1.” | A negative z-score just means the value is below the mean. |
| Forgetting the sign when finding x | 64 + 2(2.5) = 69 for z = −2 | Keep the sign: 64 + (−2)(2.5) = 59. |
Related methods
Z-scores and the normal distribution
When a distribution is roughly normal, a z-score gives the percentile directly from a table or calculator. That connection is built in the normal distribution unit. For any distribution, z-scores between −2 and 2 are common, and values farther out are unusual, much like the 1.5 × IQR rule for outliers.
Changing units
A z-score has no units, because the units cancel when you divide by the standard deviation. Changing every value in a data set, such as converting inches to centimeters, is the topic of the next lesson, transforming data.
Practice problems
- A data set has mean 50 and standard deviation 4. Find the z-score of 58.
- Using the same data set, find the z-score of 45.
- A data set has mean 200 and standard deviation 30. What value has z = 0.5?
- A data set has mean 12 and standard deviation 2.5. What value has z = −1.8?
- In a class of 25 students, 20 scores are at or below yours. What is your percentile?
- Ana scored 1350 on Test A (mean 1050, standard deviation 200). Ben scored 29 on Test B (mean 21, standard deviation 5). Who did better relative to the other test takers?
- For the data 4, 7, 9, 10, 12, 15, 18, 20, 23, 30, what percentile is 18?
- What does a z-score of 0 tell you about a value?
- A student got 70% of the questions right on a hard exam and was at the 90th percentile. Explain how both can be true.
- Use the commute graph in Example 5. What percentile is 20 minutes, and what percent of commutes are longer than 20 minutes?
Show answers
1.
z = \dfrac{58 - 50}{4} = \dfrac{8}{4}Subtract the mean, then divide by the standard deviation.
z = 2
Simplify.
Answer: z = 2
2.
z = \dfrac{45 - 50}{4} = \dfrac{-5}{4}Subtract the mean, then divide.
z = -1.25
Simplify.
Answer: z = −1.25
3.
x = 200 + (0.5)(30)
Use x = mean + z × standard deviation.
x = 200 + 15 = 215
Multiply, then add.
Answer: 215
4.
x = 12 + (-1.8)(2.5)
Substitute z = −1.8.
x = 12 - 4.5 = 7.5
Multiply, then add.
Answer: 7.5
5.
\dfrac{20}{25} = 0.80Divide the count at or below your score by the total.
0.80 \times 100 = 80
Change to a percent.
Answer: 80th percentile
6.
z_A = \dfrac{1350 - 1050}{200} = \dfrac{300}{200} = 1.5Ana’s z-score.
z_B = \dfrac{29 - 21}{5} = \dfrac{8}{5} = 1.6Ben’s z-score.
1.6 \gt 1.5
Compare.
Answer: Ben did slightly better relative to the other test takers
7.
4, 7, 9, 10, 12, 15, 18 \text{ are at or below } 18Count: 7 values.
\dfrac{7}{10} \times 100 = 70Divide by 10 and change to a percent.
Answer: 70th percentile
8.
\dfrac{x - \bar{x}}{s} = 0 \Rightarrow x = \bar{x}A fraction is 0 only when its numerator is 0.
Answer: the value equals the mean
9.
\text{Percent correct} \ne \text{percentile}Percent correct compares you with the test; a percentile compares you with other students.
Answer: the exam was hard, so most students scored below 70%; 90% of students scored at or below this student
10.
20 \text{ min} \rightarrow 40\%Read up from 20 minutes to the graph.
100\% - 40\% = 60\%
The rest of the commutes are longer.
Answer: 20 minutes is the 40th percentile, and 60% of commutes are longer than 20 minutes
Percentiles and z-scores FAQ
What is a z-score?
A z-score is the number of standard deviations a value is above or below the mean. It is found with z = (x − mean) ÷ standard deviation.
How do you calculate a percentile?
Put the data in order, count the values at or below the one you care about, divide by the total, and multiply by 100. For example, 15 of 20 values at or below a score puts it at the 75th percentile.
Can a z-score be negative?
Yes. A negative z-score means the value is below the mean. For example, z = −1 is one standard deviation below the mean.
What is the difference between percent and percentile?
A percent, like 85% correct, compares your score with the total possible. A percentile, like the 85th percentile, compares your score with everyone else’s scores.
Summary
- A percentile gives the percent of values at or below a value; Q1, the median and Q3 are the 25th, 50th and 75th percentiles.
- A z-score is z = \tfrac{x - \bar{x}}{s}: the number of standard deviations from the mean.
- Positive z is above the mean, negative z is below, and z = 0 is the mean.
- Use z-scores to compare values from different distributions.
- To find a value from a z-score, use x = \bar{x} + z \cdot s.
Previous lesson: Outliers and the 1.5 × IQR Rule
Next lesson: Transforming Data
Back to the Statistics Index