
Standard Deviation
Standard deviation measures how spread out data are around the mean. To find it, subtract the mean from each value, square those deviations, add them, divide by n − 1 (for a sample), and take the square root. A small standard deviation means the values sit close to the mean; a large one means they are spread out.
Before this lesson: Mean, Median, Mode and Range, Describing a Distribution and Square Roots
What standard deviation measures
The range only uses the two most extreme values. Standard deviation uses every value. It asks: on average, how far are the values from the mean?
A deviation is the distance of one value from the mean, x - \bar{x}. Deviations above the mean are positive and those below are negative, so they always add to 0. Squaring each deviation makes it positive. The average squared deviation is the variance, and its square root is the standard deviation, which is back in the original units.
Standard deviation formula
For a sample of n values with mean \bar{x} (the usual case):
s = \sqrt{\dfrac{\sum (x - \bar{x})^2}{n - 1}}For a whole population of N values with mean \mu (Greek letter mu):
\sigma = \sqrt{\dfrac{\sum (x - \mu)^2}{N}}Here s and \sigma (sigma) are the standard deviations, and s^2 and \sigma^2 are the variances. Dividing by n − 1 instead of n makes a sample’s variance a better estimate of the population’s variance.
Steps to find a sample standard deviation
- Find the mean, \bar{x}.
- Subtract the mean from each value to get the deviations.
- Square each deviation.
- Add the squared deviations.
- Divide by n − 1. This is the variance, s^2.
- Take the square root. This is the standard deviation, s.
Standard deviation examples
Example 1: Sample standard deviation
A sample of 5 students sent 4, 8, 6, 5 and 7 texts in one hour (example data). Find the sample variance and standard deviation.
\bar{x} = \dfrac{4 + 8 + 6 + 5 + 7}{5}Add the values and divide by 5 (see mean, median, mode and range).
\bar{x} = \dfrac{30}{5} = 6Simplify.
| x | x - \bar{x} | (x - \bar{x})^2 |
|---|---|---|
| 4 | 4 − 6 = −2 | 4 |
| 8 | 8 − 6 = 2 | 4 |
| 6 | 6 − 6 = 0 | 0 |
| 5 | 5 − 6 = −1 | 1 |
| 7 | 7 − 6 = 1 | 1 |
\textstyle\sum (x - \bar{x})^2 = 4 + 4 + 0 + 1 + 1 = 10Add the squared deviations from the last column.
s^2 = \dfrac{10}{5 - 1} = \dfrac{10}{4}Divide by n − 1 = 4.
s^2 = 2.5
This is the sample variance.
s = \sqrt{2.5} \approx 1.58Take the square root (see square roots).
Answer: the variance is 2.5 texts², and the standard deviation is about 1.58 texts. A typical student is about 1.6 texts away from the mean of 6.
Example 2: Population standard deviation
A small club has exactly 5 members, and these are all of their ages: 10, 12, 14, 16 and 18. Find the population standard deviation.
\mu = \dfrac{10 + 12 + 14 + 16 + 18}{5} = \dfrac{70}{5} = 14Find the mean of the population.
x - \mu: \; -4, \; -2, \; 0, \; 2, \; 4
Subtract 14 from each age.
(x - \mu)^2: \; 16, \; 4, \; 0, \; 4, \; 16
Square each deviation.
\textstyle\sum (x - \mu)^2 = 16 + 4 + 0 + 4 + 16 = 40
Add the squares.
\sigma^2 = \dfrac{40}{5} = 8These are all the members, so divide by N = 5.
\sigma = \sqrt{8} \approx 2.83Take the square root.
Answer: σ ≈ 2.83 years. If these 5 ages were only a sample, you would divide by 4 instead: s = \sqrt{10} \approx 3.16.
Example 3: Compare consistency (word problem)
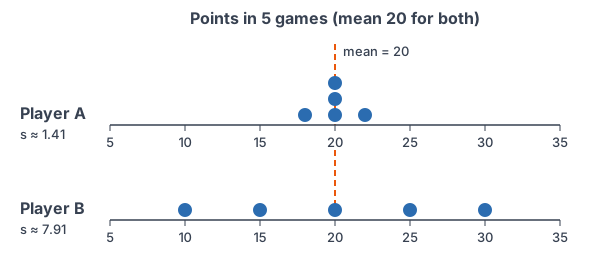
Two basketball players each average 20 points over 5 games (example data). Player A scores 18, 20, 22, 20, 20. Player B scores 10, 30, 15, 25, 20. Which player is more consistent?
\text{A deviations: } -2, \; 0, \; 2, \; 0, \; 0Subtract the mean, 20, from each of A’s scores.
\text{A: } \textstyle\sum (x - \bar{x})^2 = 4 + 0 + 4 + 0 + 0 = 8Square and add.
s_A = \sqrt{\dfrac{8}{4}} = \sqrt{2} \approx 1.41Divide by n − 1 = 4 and take the square root.
\text{B deviations: } -10, \; 10, \; -5, \; 5, \; 0Subtract 20 from each of B’s scores.
\text{B: } \textstyle\sum (x - \bar{x})^2 = 100 + 100 + 25 + 25 + 0 = 250Square and add.
s_B = \sqrt{\dfrac{250}{4}} = \sqrt{62.5} \approx 7.91Divide by 4 and take the square root.
Answer: Player A is more consistent. Both average 20 points, but A’s standard deviation is about 1.41 points and B’s is about 7.91 points.
Example 4: Use a calculator to check
The daily high temperatures for 6 days were 68, 71, 75, 70, 66 and 70 °F (example data). Find the sample standard deviation by hand, then check it with a calculator.
\bar{x} = \dfrac{68 + 71 + 75 + 70 + 66 + 70}{6} = \dfrac{420}{6} = 70Find the mean.
x - \bar{x}: \; -2, \; 1, \; 5, \; 0, \; -4, \; 0Subtract 70 from each temperature.
\textstyle\sum (x - \bar{x})^2 = 4 + 1 + 25 + 0 + 16 + 0 = 46Square the deviations and add.
s^2 = \dfrac{46}{6 - 1} = \dfrac{46}{5} = 9.2Divide by n − 1 = 5.
s = \sqrt{9.2} \approx 3.03Take the square root.
On a TI-84: enter the temperatures in L1 (STAT, 1:Edit), then STAT, CALC, 1:1-Var Stats. The screen shows x̄ = 70, Sx ≈ 3.03 (the sample standard deviation) and σx ≈ 2.77 (the population version). In Desmos: type t = [68, 71, 75, 70, 66, 70], then stdev(t) for the sample value 3.03, or stdevp(t) for the population value 2.77.
Answer: s ≈ 3.03 °F. These 6 days are a sample of the weather, so use Sx, not σx.
Example 5: Interpret a standard deviation
Scores on a test have a mean of 75 and a standard deviation of 8. How many standard deviations above the mean is a score of 91? What score is 1 standard deviation below the mean?
91 - 75 = 16
Find how far 91 is above the mean.
\dfrac{16}{8} = 2Divide by the standard deviation to count standard deviations.
75 - 8 = 67
Subtract one standard deviation from the mean.
Answer: 91 is 2 standard deviations above the mean, and 67 is 1 standard deviation below it. Measuring distance in standard deviations like this leads to z-scores, later in this unit.
Common mistakes
| Mistake | Example of the error | Fix |
|---|---|---|
| Dividing by n for a sample | Using \tfrac{10}{5} = 2 in Example 1 | For a sample, divide by n − 1: \tfrac{10}{4} = 2.5. |
| Forgetting to square the deviations | Adding −2 + 2 + 0 − 1 + 1 = 0 | Deviations always add to 0. Square each one first. |
| Stopping at the variance | Reporting 2.5 as the standard deviation | Take the square root: \sqrt{2.5} \approx 1.58. |
| Rounding the mean too early | Using 6.3 for a mean of 6.333… and getting a different answer | Keep the exact mean, or at least 4 decimal places, until the end. |
| Picking the wrong calculator value | Reporting σx for sample data | Use Sx (TI-84) or stdev (Desmos) for a sample; σx or stdevp for a whole population. |
| Expecting a negative standard deviation | “The values are below the mean, so s is negative.” | Standard deviation is never negative; it is 0 only when all values are equal. |
Related methods
Other measures of spread
The range and the interquartile range from box plots also measure spread. The IQR is resistant to outliers, while the standard deviation is not, which is why describing a distribution pairs the median with the IQR for skewed data and the mean with the standard deviation for symmetric data.
Standard deviation and z-scores
A z-score tells how many standard deviations a value is from the mean, as in Example 5. Percentiles and z-scores come later in this unit, and the standard deviation is also the key measure of spread for the normal distribution.
Practice problems
- Find the sample standard deviation of 3, 5, 7.
- Find the population standard deviation of 1, 3, 5, 7. Round to the nearest hundredth.
- Find the sample variance and standard deviation of 2, 4, 6, 8, 10.
- Without calculating, which set has the larger standard deviation: {48, 50, 52} or {30, 50, 70}? Explain.
- What is the standard deviation of 7, 7, 7, 7?
- A data set has a variance of 49. What is its standard deviation?
- A data set has a mean of 60 and a standard deviation of 5. What value is 2 standard deviations below the mean? How many standard deviations above the mean is 72.5?
- Find the sample standard deviation of the quiz scores 5, 9, 7, 11, 8.
- Find the sample and population standard deviations of 12, 15, 11, 18, 14, and give the TI-84 steps.
- The sample 5, 6, 7 has standard deviation 1. Find the sample standard deviation after adding the value 22. What does this show?
Show answers
1.
\bar{x} = \dfrac{3 + 5 + 7}{3} = 5Find the mean.
(-2)^2 + 0^2 + 2^2 = 4 + 0 + 4 = 8
Square the deviations −2, 0, 2 and add.
s^2 = \dfrac{8}{3 - 1} = 4Divide by n − 1 = 2.
s = \sqrt{4} = 2Take the square root.
Answer: s = 2
2.
\mu = \dfrac{1 + 3 + 5 + 7}{4} = 4Find the mean.
(-3)^2 + (-1)^2 + 1^2 + 3^2 = 9 + 1 + 1 + 9 = 20
Square the deviations and add.
\sigma^2 = \dfrac{20}{4} = 5Divide by N = 4.
\sigma = \sqrt{5} \approx 2.24Take the square root.
Answer: σ ≈ 2.24
3.
\bar{x} = \dfrac{30}{5} = 6The values add to 30.
16 + 4 + 0 + 4 + 16 = 40
Squared deviations of −4, −2, 0, 2, 4, added.
s^2 = \dfrac{40}{4} = 10Divide by n − 1 = 4.
s = \sqrt{10} \approx 3.16Take the square root.
Answer: variance 10, standard deviation about 3.16
4.
\text{Same mean, 50}Both sets are centered at 50.
\text{Distances } 2 \text{ vs. } 20The second set’s values are 20 from the mean instead of 2.
Answer: {30, 50, 70}, because its values are much farther from the mean
5.
x - \bar{x} = 0 \text{ for every value}The mean is 7, and every value equals 7.
s = \sqrt{0} = 0The squared deviations add to 0.
Answer: 0
6.
s = \sqrt{49} = 7The standard deviation is the square root of the variance.
Answer: 7
7.
60 - 2(5) = 50
Subtract 2 standard deviations from the mean.
\dfrac{72.5 - 60}{5} = \dfrac{12.5}{5} = 2.5Divide the distance from the mean by the standard deviation.
Answer: 50; 72.5 is 2.5 standard deviations above the mean
8.
\bar{x} = \dfrac{5 + 9 + 7 + 11 + 8}{5} = \dfrac{40}{5} = 8Find the mean.
9 + 1 + 1 + 9 + 0 = 20
Squared deviations of −3, 1, −1, 3, 0, added.
s^2 = \dfrac{20}{4} = 5Divide by n − 1 = 4.
s = \sqrt{5} \approx 2.24Take the square root.
Answer: s ≈ 2.24 points
9.
\bar{x} = \dfrac{12 + 15 + 11 + 18 + 14}{5} = \dfrac{70}{5} = 14Find the mean.
4 + 1 + 9 + 16 + 0 = 30
Squared deviations of −2, 1, −3, 4, 0, added.
s = \sqrt{\dfrac{30}{4}} = \sqrt{7.5} \approx 2.74Sample: divide by n − 1 = 4, then take the root.
\sigma = \sqrt{\dfrac{30}{5}} = \sqrt{6} \approx 2.45Population: divide by N = 5, then take the root.
\text{TI-84: STAT, 1:Edit (L1); STAT, CALC, 1:1-Var Stats}Read Sx ≈ 2.74 and σx ≈ 2.45.
Answer: s ≈ 2.74 and σ ≈ 2.45
10.
\bar{x} = \dfrac{5 + 6 + 7 + 22}{4} = \dfrac{40}{4} = 10Find the new mean.
25 + 16 + 9 + 144 = 194
Squared deviations of −5, −4, −3, 12, added.
s = \sqrt{\dfrac{194}{3}} \approx \sqrt{64.67} \approx 8.04Divide by n − 1 = 3 and take the root.
Answer: s jumps from 1 to about 8.04; one outlier changes the standard deviation a lot, so it is not resistant
Standard deviation FAQ
What does standard deviation tell you?
It tells you how far values typically are from the mean. A small standard deviation means the data are tightly grouped; a large one means they are widely spread.
What is the difference between sample and population standard deviation?
A population standard deviation (σ) uses every member of the group and divides by N. A sample standard deviation (s) uses data from part of the group and divides by n − 1.
Why do you divide by n − 1 for a sample?
A sample’s values tend to be closer to their own mean than to the population mean, so dividing by n would make the spread too small on average. Dividing by n − 1 corrects for this.
What is the difference between variance and standard deviation?
The variance is the average squared deviation, so its units are squared. The standard deviation is the square root of the variance, so it is in the same units as the data.
Summary
- Standard deviation measures the typical distance of the values from the mean.
- Sample: s = \sqrt{\tfrac{\sum (x - \bar{x})^2}{n - 1}}; population: divide by N instead.
- Steps: mean, deviations, square, add, divide, square root.
- The variance is the standard deviation squared.
- Standard deviation is never negative and is not resistant to outliers.
- On a TI-84 use Sx for samples; in Desmos use stdev (sample) or stdevp (population).
Previous lesson: Describing a Distribution
Next lesson: Outliers and the 1.5 × IQR Rule
Back to the Statistics Index