
Semi-Log Plots
A semi-log plot is a graph with a logarithmic scale on the y-axis and a regular scale on the x-axis. Exponential data, y = a \cdot b^x, makes a straight line on it, because \log y = \log a + x \log b is linear in x. The line’s slope is \log b and its intercept is \log a, so you can read the model from the line.
Before this lesson: You should know Logarithmic Scales, Exponential Functions and Properties of Logarithms.
Why Exponential Data Looks Straight
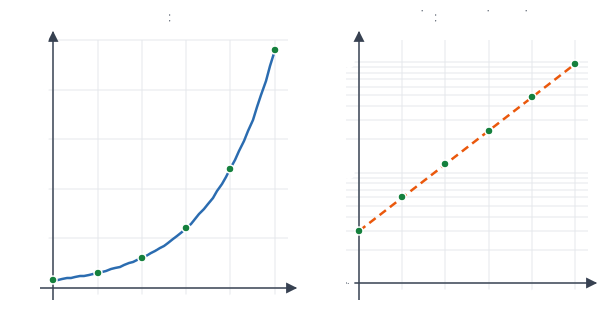
Exponential data grows by the same factor each step. On regular axes, that makes a curve that bends up faster and faster. On a log scale, every equal factor is an equal step up. So equal factors become equal rises, and the points line up.
The algebra shows the same thing. Take the log of both sides of y = a \cdot b^x. The product rule and power rule give \log y = \log a + x \log b. That has the form Y = mx + c with Y = \log y, slope m = \log b and intercept c = \log a.
Semi-Log Rules
y = a \cdot b^x \quad \Longleftrightarrow \quad \log y = (\log b)x + \log a
- If the points (x, \log y) lie on a line, the data is exponential.
- Slope of the line: m = \log b, so the growth factor is b = 10^m.
- Intercept of the line: c = \log a, so the starting value is a = 10^c.
- A positive slope means growth (b \gt 1); a negative slope means decay (0 \lt b \lt 1).
If the line uses the natural log, \ln y = mx + c, then b = e^m and a = e^c.
Worked Examples
Use a calculator for logs. Round logs to three decimal places.
Example 1: Straighten exponential data
Find \log y for y = 3 \cdot 2^x at x = 0, 1, 2, 3, 4, and show the logs make a line.
The y-values are 3, 6, 12, 24, 48
0.477, 0.778, 1.079, 1.380, 1.681
Take each log.
Subtract neighbors: 0.778 - 0.477 = 0.301, 1.079 - 0.778 = 0.301, 1.380 - 1.079 = 0.301, 1.681 - 1.380 = 0.301
The differences are equal, so the points (x, \log y) form a line with slope 0.301
Compare with the rule: \log 2 \approx 0.301, the log of the growth factor
Answer: the logs rise by \log 2 \approx 0.301 each step, so they make a straight line, as in the right graph above.
Example 2: Test data for an exponential pattern
Which data set is exponential: A: 5, 15, 45, 135 or B: 5, 15, 25, 35, both at x = 0, 1, 2, 3?
0.699, 1.176, 1.653, 2.130
Logs for A.
Differences for A: 0.477, 0.477, 0.477, all equal to \log 3
0.699, 1.176, 1.398, 1.544
Logs for B.
0.477, 0.222, 0.146
Differences for B (not equal).
Answer: A is exponential (it triples each step), so it is straight on a semi-log plot. B is linear, so on a semi-log plot it would curve and flatten out.
Example 3: From a semi-log line to a model
A semi-log line has equation \log y = 0.2x + 1.5. Write the exponential model.
Match the rule: slope m = 0.2 and intercept c = 1.5
b = 10^{0.2} \approx 1.585Find the growth factor: 10 to the power of the slope.
a = 10^{1.5} \approx 31.62Find the starting value: 10 to the power of the intercept.
y \approx 31.62(1.585)^x
Write the model.
Answer: y \approx 31.62(1.585)^x, growing about 58.5% per step.
Example 4: A model from two points
An exponential model passes through (2, 50) and (6, 800). Use logs to find it.
Take logs of the y-values: \log 50 \approx 1.699 and \log 800 \approx 2.903
m = \frac{2.903 - 1.699}{6 - 2} = \frac{1.204}{4} = 0.301Find the slope of the semi-log line (see slope)
b = 10^{0.301} \approx 2Find the growth factor: 10 to the power of the slope.
\log a = 1.699 - 2(0.301) = 1.097
Find the intercept of the log line.
a = 10^{1.097} \approx 12.5Undo the log: raise 10 to that power.
Check: 12.5 \cdot 2^2 = 50 and 12.5 \cdot 2^6 = 800
Answer: y = 12.5 \cdot 2^x
Example 5: Word problem with bacteria
A lab counts bacteria every hour: 200, 340, 578, 983 and 1,670 at t = 0, 1, 2, 3, 4. Show the growth is exponential and find the hourly growth factor.
2.301, 2.531, 2.762, 2.993, 3.223
Take logs.
Differences: 0.230, 0.231, 0.231, 0.230, nearly equal, so the semi-log plot is a straight line
m = \frac{3.223 - 2.301}{4 - 0} = \frac{0.922}{4} \approx 0.2305Find the slope from the first and last points.
b = 10^{0.2305} \approx 1.70Find the growth factor: 10 to the power of the slope.
Starting value: a = 200, the count at t = 0
Answer: N(t) \approx 200(1.70)^t. The population grows about 70% each hour.
Common Mistakes
| Mistake | Example of the error | Fix |
|---|---|---|
| Using the slope as the growth factor | Slope 0.301, so b = 0.301 | The slope is \log b. Undo the log: b = 10^{0.301} \approx 2. |
| Reading the log axis like a regular axis | Thinking the point halfway between 10 and 100 is 55 | Halfway on a log axis is 10^{1.5} \approx 31.6. |
| Taking the log of x too | Plotting (\log x, \log y) | A semi-log plot only logs y. Logging both is a log-log plot, used for power functions. |
| Mixing log and ln | Using b = e^m after taking base-10 logs | Match the base: base 10 uses 10^m; natural log uses e^m. |
| Expecting linear data to look straight | Plotting 5, 15, 25, 35 on a semi-log graph | Linear data curves and flattens on a semi-log plot. |
Related Methods
Exponential regression
With messy real data, the points won’t be exactly on a line. Fitting the best line to (x, \log y) is one way to do exponential regression.
Natural logs
Scientists often use \ln y. Then the slope k gives the model y = a e^{kx}, using the number e. Growth is k \gt 0 and decay is k \lt 0.
Log-log plots
If both axes use log scales, power functions like y = ax^n become straight lines with slope n.
Practice Problems
- The points (0, 10), (1, 100) and (2, 1000) are plotted on a semi-log graph. What is the slope of the line, and what is the model?
- Is the data 4, 12, 36, 108 (at x = 0, 1, 2, 3) exponential? Use logs.
- Is the data 2, 4, 6, 8 (at x = 0, 1, 2, 3) exponential? Use logs.
- A semi-log line is \log y = 0.5x + 1. Write the model.
- A semi-log line is \log y = -0.1x + 2. Write the model. Is it growth or decay?
- A semi-log line passes through (0, 1) and (4, 3), in the form (x, \log y). Write the model.
- Use logs to find the exponential model through (1, 6) and (3, 54).
- Find the slope and intercept of the semi-log line for y = 5(1.08)^x.
- A natural-log plot gives the line \ln y = 0.3x + 2. Write the model.
- An account holds $1,000, $1,060, $1,123.60 and $1,191.02 in years 0 to 3. Use logs to find the yearly growth rate.
Show answers
1.
Logs: 1, 2, 3, so the slope is \frac{2 - 1}{1 - 0} = 1
Growth factor 10^1 = 10, starting value 10^1 = 10
Answer: slope 1; y = 10 \cdot 10^x
2.
0.602, 1.079, 1.556, 2.033
Take the log of each value.
0.477, 0.477, 0.477
Find the differences.
Answer: yes; it triples each step (10^{0.477} \approx 3)
3.
0.301, 0.602, 0.778, 0.903
Take the log of each value.
0.301, 0.176, 0.125
Find the differences. They are not equal.
Answer: no; it is linear (adds 2 each step)
4.
b = 10^{0.5} \approx 3.162 and a = 10^1 = 10
Answer: y \approx 10(3.162)^x
5.
b = 10^{-0.1} \approx 0.794 and a = 10^2 = 100
Answer: y \approx 100(0.794)^x, decay (about 20.6% per step)
6.
Slope: \frac{3 - 1}{4 - 0} = 0.5; intercept: 1
b = 10^{0.5} \approx 3.162, a = 10^1 = 10
Answer: y \approx 10(3.162)^x
7.
Logs: \log 6 \approx 0.778 and \log 54 \approx 1.732
\frac{1.732 - 0.778}{3 - 1} = \frac{0.954}{2} = 0.477Find the slope of the log line.
b = 10^{0.477} \approx 3Undo the log: raise 10 to the slope.
a = \frac{6}{3} = 2Find the starting value: divide by the growth factor.
Answer: y = 2 \cdot 3^x (check: 2 \cdot 27 = 54)
8.
\log 1.08 \approx 0.0334
The slope is the log of the growth factor.
\log 5 \approx 0.699
The intercept is the log of the starting value.
Answer: \log y \approx 0.0334x + 0.699
9.
a = e^2 \approx 7.389 and b = e^{0.3} \approx 1.350
Answer: y \approx 7.389e^{0.3x} \approx 7.389(1.350)^x
10.
Logs: 3, 3.0253, 3.0506, 3.0759, differences all about 0.0253
10^{0.0253} \approx 1.06Find the growth factor: 10 to the power of the slope.
Answer: about 6% per year
FAQ
What is a semi-log plot used for?
It shows whether data is exponential. Exponential data makes a straight line, and the line’s slope and intercept give the growth factor and starting value.
How do you read a log axis?
Each labeled mark is 10 times the one below it. The spacing between 1 and 2 is wider than between 8 and 9, because the axis measures the log of each value.
What does the slope of a semi-log plot mean?
The slope is the log of the growth factor. A slope of m means the quantity multiplies by 10^m for each 1-unit step in x.
What is the difference between semi-log and log-log plots?
A semi-log plot uses a log scale on one axis, which straightens exponential functions. A log-log plot uses log scales on both axes, which straightens power functions.
Summary
- A semi-log plot uses a log scale on the y-axis only.
- Exponential data y = a \cdot b^x becomes the line \log y = (\log b)x + \log a.
- Growth factor: b = 10^{\text{slope}}; starting value: a = 10^{\text{intercept}}.
- Equal differences in \log y mean the data is exponential.
- For natural logs, use e^{\text{slope}} and e^{\text{intercept}}.
Previous lesson: Logarithmic Scales
Next lesson: Exponential Regression
Back to the Precalculus Index