
Exponential Regression
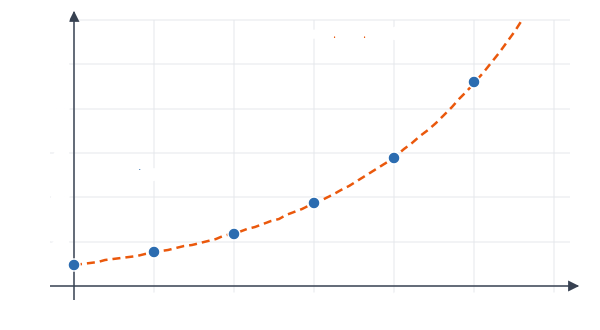
Exponential regression finds the exponential function y = a \cdot b^x that best fits a set of data points. A graphing calculator does it with the ExpReg command, giving the starting value a and the growth factor b. Use it when the data grows or decays by a roughly constant factor, then use the model to describe the trend and make predictions.
Before this lesson: You should know Semi-Log Plots, Line of Best Fit and Exponential Growth and Decay.
What Exponential Regression Does
Real data never fits a formula perfectly. A line of best fit handles data that grows by about the same amount each step. Exponential regression handles data that grows by about the same factor each step.
Behind the scenes, the calculator takes the log of every y-value. That turns exponential data into nearly straight data, as on a semi-log plot. It fits the best line to (x, \ln y), then changes the line back into y = a \cdot b^x.
Steps for Exponential Regression
- Check that an exponential model makes sense: the ratios of consecutive y-values (for equal steps in x) should be about the same. All y-values must be positive.
- Enter the x-values in list L1 and the y-values in L2.
- Run ExpReg (on a TI-84: STAT, CALC, ExpReg). Turn on diagnostics to see r.
- Write the model y = a \cdot b^x, rounding a to two decimals and b to four.
- Interpret b: if b \gt 1, growth of (b - 1) \cdot 100\% per step; if b \lt 1, decay of (1 - b) \cdot 100\% per step.
- Use the model to predict, but be careful far outside the data.
The value r that ExpReg reports measures how well a line fits (x, \ln y). A value close to 1 or −1 means the exponential model fits well.
Worked Examples
Example 1: Fit a growth model
A new video’s daily views, in thousands, for its first six days are shown. Find an exponential model.
| Day x | 0 | 1 | 2 | 3 | 4 | 5 |
|---|---|---|---|---|---|---|
| Views y (thousands) | 12 | 19 | 29 | 47 | 72 | 115 |
Check the ratios: \frac{19}{12} \approx 1.58, \frac{29}{19} \approx 1.53, \frac{47}{29} \approx 1.62, \frac{72}{47} \approx 1.53, \frac{115}{72} \approx 1.60. They are all near 1.57, so exponential is a good choice
Enter the days in L1 and the views in L2, then run ExpReg
The calculator gives a \approx 11.9925, b \approx 1.5696 and r \approx 0.9999
y \approx 11.99(1.5696)^x
Write the model.
Answer: y \approx 11.99(1.5696)^x. Since b - 1 \approx 0.5696, views grow about 57% per day.
Example 2: Make a prediction
Use the model from Example 1 to predict the views on day 8. Is the prediction reliable?
y \approx 11.99(1.5696)^8
Substitute x = 8.
1.5696^8 \approx 36.84
Find the power.
y \approx 11.99(36.84) \approx 441.7
Multiply.
Answer: about 441.7 thousand views. Day 8 is outside the data, so this is an extrapolation. Viral growth usually slows down, so treat it as a rough estimate. A logistic model may fit better over a longer time.
Example 3: Linear or exponential?
For the data in Example 1, a linear regression gives r \approx 0.951 and the exponential regression gives r \approx 0.9999. Which model fits better, and why?
19 - 12 = 7
Compare the differences. Find the first one.
29 - 19 = 10
Find the next difference.
47 - 29 = 18
Find the next difference.
72 - 47 = 25
Find the next difference.
115 - 72 = 43
Find the last difference. They keep growing, so the data is not linear.
Compare the ratios: all close to 1.57, which points to exponential.
0.9999 \gt 0.951
Compare the fits. The exponential r is closer to 1.
Answer: the exponential model fits better. Equal ratios mean exponential; equal differences would mean linear.
Example 4: Fit a decay model
A cup of coffee cools in a 70°F room. The table shows how many degrees hotter than the room it is after t minutes. Fit an exponential model and estimate the difference after 30 minutes.
| Minutes t | 0 | 5 | 10 | 15 | 20 |
|---|---|---|---|---|---|
| Degrees above room D | 140 | 101 | 74 | 53 | 39 |
Check the ratios: \frac{101}{140} \approx 0.72, \frac{74}{101} \approx 0.73, \frac{53}{74} \approx 0.72, \frac{39}{53} \approx 0.74. Nearly constant, so exponential decay fits
Run ExpReg: a \approx 139.65, b \approx 0.9380, r \approx -0.9999
D \approx 139.65(0.9380)^t
Write the model.
D \approx 139.65(0.9380)^{30} \approx 139.65(0.1466) \approx 20.5Predict at t = 30.
Answer: D \approx 139.65(0.9380)^t. The difference shrinks by about 6.2% each minute, and after 30 minutes the coffee is about 20.5°F above room temperature, near 90.5°F. Here r is negative because the data is decreasing.
Example 5: Word problem with a growing town
A town’s population, in thousands, is shown for years since 2000. Find an exponential model, predict the population in 2030, and find how long it takes to double.
| Years since 2000 t | 0 | 5 | 10 | 15 | 20 |
|---|---|---|---|---|---|
| Population P (thousands) | 52.0 | 60.3 | 70.1 | 81.2 | 94.5 |
Run ExpReg: a \approx 51.97, b \approx 1.0303, r \approx 0.99999
Write the model: P \approx 51.97(1.0303)^t, about 3.03% growth per year
P \approx 51.97(1.0303)^{30} \approx 51.97(2.449) \approx 127.3For 2030, use t = 30.
t = \frac{\ln 2}{\ln 1.0303}For doubling, solve (1.0303)^t = 2 with logs (see solving exponential equations)
t \approx \frac{0.6931}{0.02985} \approx 23.2Divide.
Answer: P \approx 51.97(1.0303)^t; about 127,300 people in 2030; the population doubles about every 23.2 years.
Common Mistakes
| Mistake | Example of the error | Fix |
|---|---|---|
| Calling b the growth rate | b = 1.5696 means 156.96% growth | The rate is b - 1 = 0.5696, or about 57%. |
| Using ExpReg with zero or negative y-values | Data with y = 0 gives an error | Exponential models need positive y. Shift the data or choose another model. |
| Trusting far extrapolations | Predicting views on day 60 | Real growth slows. Predict only a little past the data. |
| Rounding a and b too much | Using b \approx 1.6 instead of 1.5696 | Small changes in b grow huge after many steps. Keep four decimals. |
| Reading r as the fit to y | Thinking r describes (x, y) directly | ExpReg’s r is for (x, \ln y), the straightened data. |
Related Methods
By hand with two points
With two exact points, you can find a and b without a calculator. For (0, 20) and (3, 67.5): a = 20, and 20b^3 = 67.5 gives b^3 = 3.375, so b = 1.5.
Base e form
Some calculators and science courses write the model as y = ae^{kx}. Convert with k = \ln b, using the number e. For Example 1, k = \ln 1.5696 \approx 0.4508.
Linear regression on logs
Taking \ln y and running linear regression gives the line \ln y = kx + \ln a. That is the same fit ExpReg finds, shown on a semi-log plot.
Practice Problems
Use a graphing calculator. Round a to two decimals and b to four.
- Find an exponential model for x = 0, 1, 2, 3, 4 and y = 5, 8, 13, 20, 32.
- Find an exponential model for x = 1, 2, 3, 4, 5 and y = 90, 63, 45, 31, 22. What is the decay rate?
- Use your model from Problem 1 to predict y at x = 6.
- Use your model from Problem 2 to find when y is half of a.
- Find an exponential model for x = 0, 2, 4, 6, 8 and y = 3.0, 4.4, 6.6, 9.7, 14.5, then predict y at x = 10.
- Use ratios to decide if y = 1000, 1350, 1830, 2470, 3330 (at x = 0, 1, 2, 3, 4) is exponential, and estimate the growth rate.
- Is y = 4, 7, 10, 13, 16 (at x = 0, 1, 2, 3, 4) better fit by a linear or an exponential model?
- Write y \approx 11.99(1.5696)^x in the form y = ae^{kx}.
- Find the exponential model through (0, 20) and (3, 67.5) by hand.
- An account’s followers, by week, are 800, 1150, 1700, 2400, 3550, 5100 and 7450 for weeks 0 to 6. Find a model, predict week 8 and find the doubling time.
Show answers
1.
ExpReg gives a \approx 5.0394, b \approx 1.5887, r \approx 0.9999
Answer: y \approx 5.04(1.5887)^x
2.
ExpReg gives a \approx 128.1155, b \approx 0.7028, r \approx -0.9999
1 - 0.7028 = 0.2972
Find the decay rate: subtract the factor from 1.
Answer: y \approx 128.12(0.7028)^x, decaying about 29.7% per step
3.
y \approx 5.04(1.5887)^6
Substitute.
1.5887^6 \approx 16.08, so y \approx 5.04(16.08) \approx 81.0
Answer: about 81.0
4.
x = \frac{\ln 0.5}{\ln 0.7028}Solve 0.7028^x = 0.5.
x \approx \frac{-0.6931}{-0.3527} \approx 1.97Divide.
Answer: at about x = 1.97
5.
ExpReg gives a \approx 2.9874, b \approx 1.2178, r \approx 0.99996, so y \approx 2.99(1.2178)^x
y \approx 2.99(1.2178)^{10} \approx 2.99(7.174) \approx 21.45Substitute and predict.
Answer: y \approx 2.99(1.2178)^x; about 21.45
6.
Ratios: \frac{1350}{1000} = 1.35, \frac{1830}{1350} \approx 1.356, \frac{2470}{1830} \approx 1.350, \frac{3330}{2470} \approx 1.348
They are nearly equal
Answer: exponential, growing about 35% per step
7.
3, 3, 3, 3
Find the differences. They are all equal.
Answer: linear (y = 3x + 4); the ratios 1.75, 1.43, 1.3, 1.23 are not constant
8.
k = \ln 1.5696 \approx 0.4508
Find k: take the natural log of the growth factor.
Answer: y \approx 11.99e^{0.4508x}
9.
a = 20
At x = 0.
20b^3 = 67.5
At x = 3.
b^3 = \frac{67.5}{20} = 3.375Divide both sides by 20.
b = \sqrt[3]{3.375} = 1.5Take the cube root.
Answer: y = 20(1.5)^x
10.
ExpReg gives a \approx 797.96, b \approx 1.4503, r \approx 0.9999
797.96(1.4503)^8 \approx 797.96(19.57) \approx 15{,}619Predict for week 8: substitute 8.
t = \frac{\ln 2}{\ln 1.4503} \approx \frac{0.6931}{0.3718} \approx 1.86Find the doubling time: divide ln 2 by ln b.
Answer: y \approx 797.96(1.4503)^t; about 15,600 followers in week 8; doubling about every 1.86 weeks
FAQ
How do you do exponential regression on a calculator?
Put the x-values in L1 and the y-values in L2, then choose ExpReg from the STAT CALC menu. The calculator returns a and b for y = a \cdot b^x.
How do you know if data is exponential?
For equally spaced x-values, divide each y-value by the one before it. If the ratios are about the same, an exponential model fits.
What does the b value mean in exponential regression?
It is the growth factor per unit of x. If b = 1.08, the quantity grows 8% per step; if b = 0.92, it shrinks 8% per step.
Why is my r negative?
For a decay model, \ln y goes down as x goes up, so the correlation is negative. A value near −1 still means a strong fit.
Summary
- Exponential regression fits y = a \cdot b^x to data that changes by a nearly constant factor.
- Check that the ratios of consecutive y-values are about equal and all y-values are positive.
- Use ExpReg; read a (start) and b (growth factor), and check r.
- Growth or decay rate is b - 1 or 1 - b.
- Predict carefully; extrapolating far beyond the data is risky.
Previous lesson: Semi-Log Plots
Next lesson: Logistic Functions
Back to the Precalculus Index