
Two-Sample t-Test
A two-sample t-test checks whether two population means differ. You compare the sample means using t = (x̄₁ − x̄₂) ÷ √(s₁²/n₁ + s₂²/n₂). For degrees of freedom, use the smaller of n₁ − 1 and n₂ − 1, or the calculator’s value. A small p-value is evidence that μ₁ and μ₂ are different.
Before this lesson: One-Sample t-Test, Confidence Interval for a Difference in Means and Paired t-Test
How the test works
Suppose one group of students drinks coffee and another drinks a placebo before a reaction-time test. The coffee group is faster on average. Is the gap real, or could random chance make a gap that big?
The null hypothesis says the two population means are equal: H₀: μ₁ = μ₂, or μ₁ − μ₂ = 0. The t statistic says how many standard errors the gap x̄₁ − x̄₂ is from 0.
The two groups must be independent: no value in one group is linked to a value in the other. If the data come in pairs, use the paired t-test instead.
Two-sample t-test formula
t = \dfrac{\bar{x}_1 - \bar{x}_2}{\sqrt{\dfrac{s_1^2}{n_1} + \dfrac{s_2^2}{n_2}}}- H₀: μ₁ = μ₂. Hₐ is μ₁ > μ₂, μ₁ < μ₂ or μ₁ ≠ μ₂.
- Degrees of freedom: by hand, use the conservative df = the smaller of n₁ − 1 and n₂ − 1. A calculator uses a more exact df (often a decimal), which gives a slightly smaller p-value.
- On a TI-84: STAT, TESTS, 4:2-SampTTest. Enter x̄₁, s₁, n₁, x̄₂, s₂, n₂, the direction of Hₐ, and choose Pooled: No.
Conditions
- Random: two independent random samples, or two groups from a randomized experiment.
- 10%: when sampling without replacement, each sample is at most 10% of its population.
- Normal/Large Sample: for each group, the population is roughly normal or n ≥ 30. For a small group, graph its data and check for strong skew or outliers.
Two-sample t-test examples
Example 1: Find the t statistic
Group 1 has x̄₁ = 84, s₁ = 6 and n₁ = 25. Group 2 has x̄₂ = 80, s₂ = 8 and n₂ = 36. Find t and the conservative df.
6^2 = 36
Square s₁.
\dfrac{36}{25} = 1.44Divide by n₁.
8^2 = 64
Square s₂.
\dfrac{64}{36} \approx 1.778Divide by n₂.
1.44 + 1.778 = 3.218
Add the two parts.
\text{SE} = \sqrt{3.218} \approx 1.794Take the square root (see square roots).
84 - 80 = 4
Subtract the sample means.
t = \dfrac{4}{1.794} \approx 2.230Divide by SE.
\text{df} = 25 - 1 = 24Use the smaller sample size minus 1.
Answer: t ≈ 2.23 with conservative df = 24.
Example 2: Caffeine and reaction time (word problem)
A researcher randomly assigns 42 volunteers to two groups. The 20 who get caffeine have a mean reaction time of 241 ms with s = 18 ms. The 22 who get a placebo have a mean of 255 ms with s = 21 ms. Neither group’s data show strong skew or outliers. Does caffeine lower the mean reaction time? Use α = 0.05.
State: H₀: μ₁ = μ₂ and Hₐ: μ₁ < μ₂, where μ₁ and μ₂ are the true mean reaction times with caffeine and with a placebo. Plan: two-sample t-test. The groups come from random assignment, and both groups pass the normality check.
\dfrac{18^2}{20} = \dfrac{324}{20} = 16.2Square s₁ and divide by n₁.
\dfrac{21^2}{22} = \dfrac{441}{22} \approx 20.05Square s₂ and divide by n₂.
16.2 + 20.05 = 36.25
Add the two parts.
\text{SE} = \sqrt{36.25} \approx 6.021Take the square root.
241 - 255 = -14
Subtract the sample means.
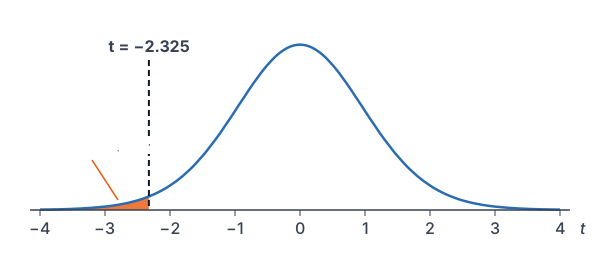
t = \dfrac{-14}{6.021} \approx -2.325Divide by SE.
\text{df} = 20 - 1 = 19Use the smaller sample size minus 1.
P(t \le -2.325) = \text{tcdf}(-10^{99}, -2.325, 19)Find the left-tail area.
\approx 0.0157
Read the calculator result.
0.0157 \lt 0.05
Compare the p-value with α.
Conclude: the p-value is about 0.0157, which is less than 0.05, so reject H₀. There is convincing evidence that caffeine lowers the mean reaction time. Because the groups were randomly assigned, caffeine likely caused the difference.
Example 3: A two-sided test
A reporter takes random samples of workers in two cities. In City A, 15 workers have a mean commute of 28.4 minutes with s = 7.2. In City B, 12 workers have a mean of 24.9 minutes with s = 5.1. Both samples show no strong skew or outliers. Do the mean commute times differ? Use α = 0.05.
7.2^2 = 51.84
Square s₁.
\dfrac{51.84}{15} = 3.456Divide by n₁.
5.1^2 = 26.01
Square s₂.
\dfrac{26.01}{12} = 2.1675Divide by n₂.
3.456 + 2.1675 = 5.6235
Add the two parts.
\text{SE} = \sqrt{5.6235} \approx 2.371Take the square root.
28.4 - 24.9 = 3.5
Subtract the sample means.
t = \dfrac{3.5}{2.371} \approx 1.476Divide by SE.
\text{df} = 12 - 1 = 11Use the smaller sample size minus 1.
P(t \ge 1.476) = \text{tcdf}(1.476, 10^{99}, 11) \approx 0.0840Find one tail.
2 \cdot 0.0840 = 0.1680
Double it for a two-sided test.
0.1680 \gt 0.05
Compare the p-value with α.
Answer: with H₀: μ₁ = μ₂ and Hₐ: μ₁ ≠ μ₂, the p-value is about 0.168, so fail to reject H₀. The data don’t give convincing evidence that the mean commutes differ. (The TI-84 uses df ≈ 24.7 and gives p ≈ 0.153, which leads to the same conclusion.)
Example 4: Matching a test with an interval
Use the commute data from Example 3. Build a 95% confidence interval for μ₁ − μ₂ with df = 11. Does it agree with the test?
t^* = \text{invT}(0.975, 11) \approx 2.201Find t* for 95% confidence with df = 11.
\text{ME} = 2.201 \cdot 2.371 \approx 5.219Multiply t* by SE.
3.5 - 5.219 = -1.719
Subtract ME.
3.5 + 5.219 = 8.719
Add ME.
Answer: about (−1.72, 8.72) minutes. The interval contains 0, so “no difference” is plausible, which matches the test. This is the confidence interval for a difference in means.
Example 5: Checking the conditions
A study compares random samples of house prices in two towns. Town A has 12 prices, and one house costs far more than the rest. Town B has 40 prices with a strong right skew. Can you use a two-sample t-test?
40 \ge 30
Compare n₂ with 30.
12 \lt 30
Compare n₁ with 30.
Answer: Town B is fine because n₂ ≥ 30. Town A is not: its sample is small and has an outlier. Both groups must pass, so the two-sample t-test is not safe here.
Common mistakes
| Mistake | Example of the error | Fix |
|---|---|---|
| Using a two-sample test on paired data | Comparing before and after scores of the same students as two groups | Use a paired t-test on the differences. |
| Adding standard deviations instead of variances | SE = √(18/20 + 21/22) | Square each s first: SE = √(18²/20 + 21²/22). |
| Using n₁ + n₂ − 1 for df | df = 41 for groups of 20 and 22 | By hand, use the smaller n minus 1: df = 19. |
| Claiming cause from an observational study | “Living in City A causes longer commutes.” | Only a randomized experiment supports cause and effect. |
| Saying “the means are equal” after failing to reject | “The two cities have the same mean commute.” | Say the data don’t give convincing evidence of a difference. |
Related methods
Estimating the difference
To estimate how big the difference is, use the confidence interval for a difference in means: (x̄₁ − x̄₂) ± t* · SE.
Comparing proportions instead
If the response is a category (yes or no) rather than a number, compare groups with a two-proportion z-test instead.
Practice problems
- Group 1 has s₁ = 4 and n₁ = 16. Group 2 has s₂ = 6 and n₂ = 9. Find the standard error of x̄₁ − x̄₂.
- Use Problem 1 with x̄₁ = 50 and x̄₂ = 46. Find t and the conservative df.
- Use Problem 2 with Hₐ: μ₁ > μ₂. Find the p-value.
- A two-sided two-sample t-test gives t = −2.5 with df = 14. Find the p-value.
- Write H₀ and Hₐ to test whether students who sleep 8+ hours have a higher mean GPA than students who sleep less.
- Random samples of students who took an exam online (n = 35, x̄ = 78.2, s = 9.5) and in person (n = 40, x̄ = 74.1, s = 11.2) are compared. Test Hₐ: μ₁ ≠ μ₂ at α = 0.05.
- In a randomized experiment, a two-sample t-test of a new teaching method gives a p-value of 0.012. Write the conclusion at α = 0.05.
- Should you use a two-sample t-test or a paired t-test? (a) Test scores of 30 students before and after a course. (b) Test scores of 30 students in one class and 28 in another.
- Why does the two-sample t-test not pool the two standard deviations?
- Two random samples have n₁ = 10 and n₂ = 12. Dot plots of both show roughly symmetric data with no outliers. Is the Normal/Large Sample condition met?
Show answers
1.
\dfrac{4^2}{16} = \dfrac{16}{16} = 1Square s₁ and divide by n₁.
\dfrac{6^2}{9} = \dfrac{36}{9} = 4Square s₂ and divide by n₂.
1 + 4 = 5
Add the two parts.
\text{SE} = \sqrt{5} \approx 2.236Take the square root.
Answer: SE ≈ 2.236
2.
50 - 46 = 4
Subtract the sample means.
t = \dfrac{4}{2.236} \approx 1.789Divide by SE.
\text{df} = 9 - 1 = 8Use the smaller sample size minus 1.
Answer: t ≈ 1.789 with df = 8
3.
P(t \ge 1.789) = \text{tcdf}(1.789, 10^{99}, 8) \approx 0.0557Find the right-tail area.
Answer: about 0.0557
4.
P(t \le -2.5) = \text{tcdf}(-10^{99}, -2.5, 14) \approx 0.01273Find one tail.
2 \cdot 0.01273 \approx 0.0255
Double it for a two-sided test.
Answer: about 0.0255
5.
Answer: H₀: μ₁ = μ₂ and Hₐ: μ₁ > μ₂, where μ₁ and μ₂ are the true mean GPAs of students who sleep 8+ hours and students who sleep less.
6.
\dfrac{9.5^2}{35} = \dfrac{90.25}{35} \approx 2.579Square s₁ and divide by n₁.
\dfrac{11.2^2}{40} = \dfrac{125.44}{40} = 3.136Square s₂ and divide by n₂.
2.579 + 3.136 = 5.715
Add the two parts.
\text{SE} = \sqrt{5.715} \approx 2.391Take the square root.
78.2 - 74.1 = 4.1
Subtract the sample means.
t = \dfrac{4.1}{2.391} \approx 1.715Divide by SE.
\text{df} = 35 - 1 = 34Use the smaller sample size minus 1.
P(t \ge 1.715) = \text{tcdf}(1.715, 10^{99}, 34) \approx 0.0477Find one tail.
2 \cdot 0.0477 = 0.0954
Double it for a two-sided test.
0.0954 \gt 0.05
Compare with α.
Answer: p-value ≈ 0.095, so fail to reject H₀. The data don’t give convincing evidence that the mean scores differ for online and in-person exams.
7.
0.012 \lt 0.05
Compare the p-value with α.
Answer: Reject H₀. There is convincing evidence that the new method changes the mean score, and because of random assignment, the method likely caused the difference.
8.
Answer: (a) Paired t-test, because each student gives two linked scores. (b) Two-sample t-test, because the two classes are separate groups.
9.
Answer: The two populations may have different spreads. Using each sample’s own s keeps the test accurate when the spreads differ.
10.
Answer: Yes. Both samples are small, but their dot plots show no strong skew or outliers, so the condition is met for each group.
Two-sample t-test FAQ
What is the formula for a two-sample t-test?
The test statistic is t = (x̄₁ − x̄₂) ÷ √(s₁²/n₁ + s₂²/n₂). The p-value comes from a t-distribution with the conservative df (smaller n minus 1) or the calculator’s df.
How do you find degrees of freedom for a two-sample t-test?
By hand, use the smaller of n₁ − 1 and n₂ − 1. Calculators and software use a longer formula (Welch’s) that usually gives a decimal df between that value and n₁ + n₂ − 2.
What is the difference between a two-sample t-test and a paired t-test?
A two-sample t-test compares two independent groups. A paired t-test is for linked pairs, such as before-and-after measurements on the same people, and it works with the differences.
How do you do a 2-SampTTest on a TI-84?
Press STAT, choose TESTS, then 4:2-SampTTest. Enter each group’s x̄, s and n, choose the direction of Hₐ, set Pooled to No, then choose Calculate.
Summary
- Use a two-sample t-test to check H₀: μ₁ = μ₂ for two independent groups.
- t = (x̄₁ − x̄₂) ÷ √(s₁²/n₁ + s₂²/n₂).
- By hand, df = the smaller of n₁ − 1 and n₂ − 1; a calculator uses a more exact df.
- Check Random, 10% and Normal/Large Sample for both groups.
- Conclude in context. Only a randomized experiment supports cause and effect.
Previous lesson: Paired t-Test
Next lesson: Chi-Square Goodness-of-Fit Test
Back to the Statistics Index