
Two-Proportion z-Test
A two-proportion z-test checks whether two population proportions differ. You compare the sample proportions p̂₁ and p̂₂ using z = (p̂₁ − p̂₂) ÷ √(p̂c(1 − p̂c)(1/n₁ + 1/n₂)), where p̂c is the pooled proportion of successes in both samples. A small p-value is evidence that p₁ and p₂ are different.
Before this lesson: One-Proportion z-Test, Sampling Distributions for Differences and Type I and Type II Errors
How the test works
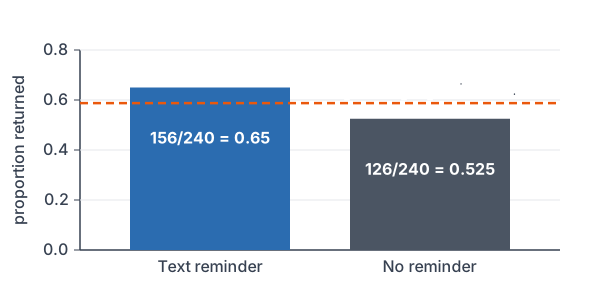
Suppose a school sends text reminders to some families and not to others. More families return a form in the text group. Is that gap real, or could chance alone make a gap that big?
The null hypothesis says there is no difference: H₀: p₁ = p₂, or p₁ − p₂ = 0. If H₀ is true, both groups share one success rate. Your best estimate of that shared rate is the pooled proportion: all the successes divided by all the trials.
The z statistic says how many standard errors the gap p̂₁ − p̂₂ is from 0. The standard error uses the pooled proportion, because the test assumes H₀ is true.
Two-proportion z-test formula
\hat{p}_c = \dfrac{x_1 + x_2}{n_1 + n_2}z = \dfrac{\hat{p}_1 - \hat{p}_2}{\sqrt{\hat{p}_c(1 - \hat{p}_c)\left(\dfrac{1}{n_1} + \dfrac{1}{n_2}\right)}}- x₁ and x₂ are the numbers of successes, and n₁ and n₂ are the sample sizes.
- H₀: p₁ = p₂. Hₐ is p₁ > p₂, p₁ < p₂ or p₁ ≠ p₂.
- The p-value is the tail area beyond z that matches Hₐ (both tails for ≠).
- On a TI-84: STAT, TESTS, 6:2-PropZTest. Enter x₁, n₁, x₂, n₂ and the direction of Hₐ.
Conditions
- Random: two independent random samples, or two groups from a randomized experiment.
- 10%: when sampling without replacement, each sample is at most 10% of its population.
- Large Counts: n₁p̂c, n₁(1 − p̂c), n₂p̂c and n₂(1 − p̂c) are all at least 10.
Two-proportion z-test examples
Example 1: Find the pooled proportion
In one class, 18 of 30 students have a part-time job. In another class, 12 of 30 do. Find each sample proportion and the pooled proportion.
\hat{p}_1 = \dfrac{18}{30} = 0.6Divide successes by n₁.
\hat{p}_2 = \dfrac{12}{30} = 0.4Divide successes by n₂.
\hat{p}_c = \dfrac{18 + 12}{30 + 30}Add the successes and add the sample sizes.
= \dfrac{30}{60} = 0.5Divide.
Answer: p̂₁ = 0.6, p̂₂ = 0.4 and p̂c = 0.5. The pooled proportion always falls between the two sample proportions.
Example 2: Text reminders (word problem)
A school randomly assigns 480 families to two groups of 240. One group gets a text reminder about a form, and 156 return it. The other group gets no text, and 126 return it. Do text reminders raise the return rate? Use α = 0.05.
State: H₀: p₁ = p₂ and Hₐ: p₁ > p₂, where p₁ and p₂ are the true return rates with and without a text. Plan: two-proportion z-test. The groups come from random assignment, and the counts below are at least 10.
\hat{p}_1 = \dfrac{156}{240} = 0.65Divide successes by n₁.
\hat{p}_2 = \dfrac{126}{240} = 0.525Divide successes by n₂.
\hat{p}_c = \dfrac{156 + 126}{240 + 240} = \dfrac{282}{480} = 0.5875Pool the successes and the sample sizes.
240 \cdot 0.5875 = 141
Check n p̂c ≥ 10 (same for both groups).
240 \cdot 0.4125 = 99
Check n(1 − p̂c) ≥ 10.
0.5875 \cdot 0.4125 \approx 0.2423
Multiply p̂c(1 − p̂c).
\dfrac{1}{240} + \dfrac{1}{240} \approx 0.008333Add the reciprocals of the sample sizes (see adding fractions).
0.2423 \cdot 0.008333 \approx 0.002019
Multiply the two parts.
\text{SE} = \sqrt{0.002019} \approx 0.04493Take the square root (see square roots).
0.65 - 0.525 = 0.125
Subtract the sample proportions.
z = \dfrac{0.125}{0.04493} \approx 2.782Divide by SE.
P(Z \ge 2.782) = \text{normalcdf}(2.782, 10^{99})Find the right-tail area (see normal probability calculations).
\approx 0.0027
Read the calculator result.
0.0027 \lt 0.05
Compare the p-value with α.
Conclude: the p-value is about 0.0027, which is less than 0.05, so reject H₀. There is convincing evidence that text reminders raise the return rate. Because this was a randomized experiment, the texts likely caused the increase.
Example 3: A two-sided test
A survey takes random samples of students at two large high schools. At School A, 54 of 300 walk to school. At School B, 45 of 200 walk. Is there a difference in the proportions who walk? Use α = 0.05.
\hat{p}_1 = \dfrac{54}{300} = 0.18Divide successes by n₁.
\hat{p}_2 = \dfrac{45}{200} = 0.225Divide successes by n₂.
\hat{p}_c = \dfrac{54 + 45}{300 + 200} = \dfrac{99}{500} = 0.198Pool the successes and the sample sizes.
200 \cdot 0.198 = 39.6
Check the smallest count; the others are larger.
0.198 \cdot 0.802 \approx 0.1588
Multiply p̂c(1 − p̂c).
\dfrac{1}{300} + \dfrac{1}{200} \approx 0.008333Add the reciprocals of the sample sizes.
0.1588 \cdot 0.008333 \approx 0.001323
Multiply the two parts.
\text{SE} = \sqrt{0.001323} \approx 0.03637Take the square root.
0.18 - 0.225 = -0.045
Subtract the sample proportions.
z = \dfrac{-0.045}{0.03637} \approx -1.237Divide by SE.
P(Z \le -1.237) = \text{normalcdf}(-10^{99}, -1.237)Find one tail.
\approx 0.1080
Read the calculator result.
2 \cdot 0.1080 = 0.2160
Double it for a two-sided test.
0.2160 \gt 0.05
Compare the p-value with α.
Answer: with H₀: p₁ = p₂ and Hₐ: p₁ ≠ p₂, the p-value is about 0.216, so fail to reject H₀. The data don’t give convincing evidence that the walking rates at the two schools differ.
Example 4: When the test can’t be used
A small study finds that 3 of 40 people on Diet A and 5 of 50 people on Diet B get a headache. Can you use a two-proportion z-test?
\hat{p}_c = \dfrac{3 + 5}{40 + 50} = \dfrac{8}{90} \approx 0.0889Pool the successes and the sample sizes.
40 \cdot 0.0889 \approx 3.56
Find n₁p̂c.
3.56 \lt 10
Compare with 10.
Answer: No. The expected count of headaches in the first group is only about 3.56, so the Large Counts condition fails and the normal model is not reliable.
Example 5: Matching a test with an interval
Use the walking data from Example 3. Build a 95% confidence interval for p₁ − p₂. Does it agree with the test?
0.18 \cdot 0.82 = 0.1476
Multiply p̂₁(1 − p̂₁); intervals don’t pool.
\dfrac{0.1476}{300} = 0.000492Divide by n₁.
0.225 \cdot 0.775 = 0.174375
Multiply p̂₂(1 − p̂₂).
\dfrac{0.174375}{200} = 0.000871875Divide by n₂.
0.000492 + 0.000871875 = 0.001363875
Add the two variances.
\text{SE} = \sqrt{0.001363875} \approx 0.03693Take the square root.
1.96 \cdot 0.03693 \approx 0.0724
Multiply z* = 1.96 by SE.
-0.045 - 0.0724 = -0.1174
Subtract the margin of error.
-0.045 + 0.0724 = 0.0274
Add the margin of error.
Answer: about (−0.117, 0.027). The interval contains 0, so “no difference” is plausible. That matches the two-sided test, which failed to reject H₀. This interval is the confidence interval for a difference in proportions.
Common mistakes
| Mistake | Example of the error | Fix |
|---|---|---|
| Not pooling in the test | SE = √(0.65 · 0.35/240 + 0.525 · 0.475/240) | A test assumes p₁ = p₂, so use p̂c in the SE. |
| Averaging the two proportions | p̂c = (0.18 + 0.225)/2 | Pool the counts: p̂c = (54 + 45)/(300 + 200) = 0.198. |
| Not doubling a two-sided p-value | Reporting 0.108 for Hₐ: p₁ ≠ p₂ | Two-sided p-value = 2 × 0.108 = 0.216. |
| Claiming cause from a survey | “Living near School B makes students walk.” | Only a randomized experiment supports a cause-and-effect conclusion. |
| Concluding about the samples | “65% beat 52.5%, so reject.” | Conclude about the population proportions p₁ and p₂. |
Related methods
Estimating the size of the difference
A test answers “is there a difference?” To estimate how big the difference is, use the confidence interval for a difference in proportions, which uses p̂₁ and p̂₂ separately, not p̂c.
More than two groups
To compare proportions across three or more groups, use a chi-square test. With exactly two groups, it gives the same p-value as a two-sided two-proportion z-test.
Practice problems
- In one sample, 30 of 80 people say yes. In another, 42 of 120 say yes. Find the pooled proportion.
- Use Problem 1. Find the standard error for a two-proportion z-test.
- Use Problems 1 and 2. Find z.
- Use Problem 3. Find the p-value for Hₐ: p₁ ≠ p₂.
- Samples of 50 and 60 give a pooled proportion of 0.1. Is the Large Counts condition met?
- Write H₀ and Hₐ to test whether the proportion of left-handed students differs between boys and girls.
- A website shows Ad A to 800 random visitors and Ad B to 800 others. Ad A gets 64 clicks and Ad B gets 40. Test whether Ad A has a higher click rate. Use α = 0.05.
- A two-proportion z-test comparing two towns’ recycling rates gives a p-value of 0.21. Write the conclusion at α = 0.05.
- Why does the test use the pooled proportion in the standard error?
- In a randomized experiment, a two-proportion z-test of a new study app gives a p-value of 0.003. Can you conclude the app causes higher pass rates at α = 0.01?
Show answers
1.
\hat{p}_c = \dfrac{30 + 42}{80 + 120} = \dfrac{72}{200}Pool the successes and the sample sizes.
= 0.36
Divide.
Answer: p̂c = 0.36
2.
0.36 \cdot 0.64 = 0.2304
Multiply p̂c(1 − p̂c).
\dfrac{1}{80} + \dfrac{1}{120} \approx 0.02083Add the reciprocals of the sample sizes.
0.2304 \cdot 0.02083 \approx 0.0048
Multiply the two parts.
\text{SE} = \sqrt{0.0048} \approx 0.06928Take the square root.
Answer: SE ≈ 0.06928
3.
\hat{p}_1 = \dfrac{30}{80} = 0.375Divide by n₁.
\hat{p}_2 = \dfrac{42}{120} = 0.35Divide by n₂.
0.375 - 0.35 = 0.025
Subtract the sample proportions.
z = \dfrac{0.025}{0.06928} \approx 0.361Divide by SE.
Answer: z ≈ 0.361
4.
P(Z \ge 0.361) = \text{normalcdf}(0.361, 10^{99}) \approx 0.3590Find one tail.
2 \cdot 0.3590 = 0.718
Double it for a two-sided test.
Answer: p-value ≈ 0.718
5.
50 \cdot 0.1 = 5
Find n₁p̂c.
5 \lt 10
Compare with 10.
Answer: No. The count 5 is less than 10, so Large Counts fails.
6.
Answer: H₀: p₁ = p₂ and Hₐ: p₁ ≠ p₂, where p₁ and p₂ are the true proportions of left-handed boys and girls.
7.
\hat{p}_A = \dfrac{64}{800} = 0.08Divide clicks by visitors for Ad A.
\hat{p}_B = \dfrac{40}{800} = 0.05Divide for Ad B.
\hat{p}_c = \dfrac{64 + 40}{800 + 800} = \dfrac{104}{1600} = 0.065Pool the successes and the sample sizes.
800 \cdot 0.065 = 52
Check the smaller count.
0.065 \cdot 0.935 = 0.060775
Multiply p̂c(1 − p̂c).
\dfrac{1}{800} + \dfrac{1}{800} = 0.0025Add the reciprocals of the sample sizes.
0.060775 \cdot 0.0025 \approx 0.0001519
Multiply the two parts.
\text{SE} = \sqrt{0.0001519} \approx 0.01232Take the square root.
0.08 - 0.05 = 0.03
Subtract the sample proportions.
z = \dfrac{0.03}{0.01232} \approx 2.435Divide by SE.
P(Z \ge 2.435) = \text{normalcdf}(2.435, 10^{99}) \approx 0.0074Find the right-tail area.
0.0074 \lt 0.05
Compare with α.
Answer: p-value ≈ 0.0074, so reject H₀: p_A = p_B. There is convincing evidence that Ad A has a higher click rate.
8.
0.21 \gt 0.05
Compare the p-value with α.
Answer: Fail to reject H₀. The data don’t give convincing evidence that the two towns’ recycling rates differ.
9.
Answer: The test assumes H₀: p₁ = p₂ is true. If both groups share one rate, the best estimate of it combines all the data, which is the pooled proportion.
10.
0.003 \lt 0.01
Compare the p-value with α.
Answer: Yes. The p-value is below 0.01, and random assignment means the app likely caused the higher pass rate.
Two-proportion z-test FAQ
What is the formula for a two-proportion z-test?
The test statistic is z = (p̂₁ − p̂₂) ÷ √(p̂c(1 − p̂c)(1/n₁ + 1/n₂)), where p̂c is the pooled proportion. The p-value is the matching tail area under the standard normal curve.
What is the pooled proportion?
The pooled proportion is the total number of successes in both samples divided by the total sample size: p̂c = (x₁ + x₂)/(n₁ + n₂). It estimates the shared rate that H₀ assumes.
How do you do a 2-PropZTest on a TI-84?
Press STAT, choose TESTS, then 6:2-PropZTest. Enter x₁, n₁, x₂, n₂ and the direction of Hₐ, then choose Calculate. The calculator shows z, the p-value and p̂c.
When do you pool in a two-proportion test?
Pool only in the significance test, because it assumes p₁ = p₂. A confidence interval for p₁ − p₂ doesn’t assume the proportions are equal, so it uses p̂₁ and p̂₂ separately.
Summary
- Use a two-proportion z-test to check H₀: p₁ = p₂.
- Pool the data: p̂c = (x₁ + x₂)/(n₁ + n₂).
- z = (p̂₁ − p̂₂) ÷ √(p̂c(1 − p̂c)(1/n₁ + 1/n₂)).
- Check Random, 10% and Large Counts with p̂c for both groups.
- Find the p-value that matches Hₐ, compare it with α and conclude in context. Only a randomized experiment supports cause and effect.
Previous lesson: Type I and Type II Errors
Next lesson: One-Sample t-Test
Back to the Statistics Index