
One-Sample t-Test
A one-sample t-test checks a claim about a single population mean μ. You compare the sample mean x̄ with the claimed value μ₀ using t = (x̄ − μ₀) ÷ (s/√n), with n − 1 degrees of freedom. Then you find the p-value from a t-distribution. A small p-value is evidence against the claim.
Before this lesson: t-Distribution, Confidence Interval for a Mean and P-Values
How the test works
Suppose a coffee shop says its large cups hold 16 ounces on average. If that is true, sample means from random samples center on 16. Their spread is the standard error s/√n.
The t statistic says how many standard errors x̄ is from μ₀. We use t instead of z because we don’t know the population standard deviation σ. We estimate it with the sample standard deviation s, which adds extra uncertainty. The t-distribution has heavier tails to allow for that.
The shape of the t curve depends on the degrees of freedom, df = n − 1. Larger samples give t curves closer to the standard normal curve.
One-sample t-test formula
t = \dfrac{\bar{x} - \mu_0}{s / \sqrt{n}}, \quad \text{df} = n - 1- H₀: μ = μ₀, and Hₐ is μ > μ₀, μ < μ₀ or μ ≠ μ₀.
- The p-value is the tail area beyond t that matches Hₐ (both tails for ≠).
- On a TI-84: STAT, TESTS, 2:T-Test. Choose Data or Stats, enter μ₀ and x̄, s, n (or the data list), and the direction of Hₐ. The p-value command by hand is tcdf(lower, upper, df).
Conditions
- Random: the data come from a random sample or a randomized experiment.
- 10%: when sampling without replacement, n is at most 10% of the population.
- Normal/Large Sample: the population is roughly normal, or n ≥ 30. For a small sample, graph the data and check that there is no strong skew and there are no outliers.
One-sample t-test examples
Example 1: Find the t statistic
A sample of n = 36 has x̄ = 52.4 and s = 6. Find t and df for H₀: μ = 50.
\sqrt{36} = 6Take the square root of n.
\text{SE} = \dfrac{6}{6} = 1Divide s by √n.
52.4 - 50 = 2.4
Subtract μ₀ from x̄.
t = \dfrac{2.4}{1} = 2.4Divide by SE.
\text{df} = 36 - 1 = 35Subtract 1 from n.
Answer: t = 2.4 with df = 35. The sample mean is 2.4 standard errors above the claimed mean.
Example 2: Coffee cups (word problem)
A customer thinks a shop’s large cups hold less than the claimed 16 ounces. She measures a random sample of 10 cups (in ounces): 15.6, 15.9, 16.1, 15.7, 15.8, 16.0, 15.5, 15.9, 15.8, 15.7. Test at α = 0.05.
State: H₀: μ = 16 and Hₐ: μ < 16, where μ is the true mean fill of all large cups. Plan: one-sample t-test. The sample is random, 10 cups is less than 10% of all cups, and a dot plot of the data shows no strong skew or outliers.
15.6 + 15.9 + \dots + 15.7 = 158.0
Add the 10 values.
\bar{x} = \dfrac{158.0}{10} = 15.8Divide by n.
0.04 + 0.01 + 0.09 + 0.01 + 0 + 0.04 + 0.09 + 0.01 + 0 + 0.01 = 0.30
Add the squared deviations from 15.8.
\dfrac{0.30}{9} \approx 0.03333Divide by n − 1 (see standard deviation).
s = \sqrt{0.03333} \approx 0.1826Take the square root (see square roots).
\text{SE} = \dfrac{0.1826}{\sqrt{10}} \approx 0.05774Divide s by √n.
15.8 - 16 = -0.2
Subtract μ₀ from x̄.
t = \dfrac{-0.2}{0.05774} \approx -3.464Divide by SE.
\text{df} = 10 - 1 = 9Subtract 1 from n.
P(t \le -3.464) = \text{tcdf}(-10^{99}, -3.464, 9)Find the left-tail area.
\approx 0.0036
Read the calculator result.
0.0036 \lt 0.05
Compare the p-value with α.
Conclude: the p-value is about 0.0036, which is less than 0.05, so reject H₀. There is convincing evidence that the shop’s large cups hold less than 16 ounces on average.
Example 3: A two-sided test
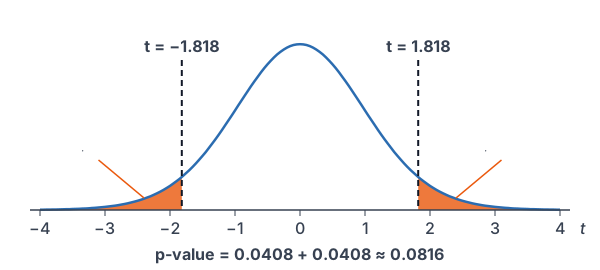
A health article says teens sleep 8 hours a night on average. A random sample of 25 students at a large school has x̄ = 7.6 hours and s = 1.1 hours, and the data show no strong skew. Is the mean for this school different from 8? Use α = 0.05.
\text{SE} = \dfrac{1.1}{\sqrt{25}} = \dfrac{1.1}{5} = 0.22Divide s by √n.
7.6 - 8 = -0.4
Subtract μ₀ from x̄.
t = \dfrac{-0.4}{0.22} \approx -1.818Divide by SE.
\text{df} = 25 - 1 = 24Subtract 1 from n.
P(t \le -1.818) = \text{tcdf}(-10^{99}, -1.818, 24)Find one tail.
\approx 0.0408
Read the calculator result.
2 \cdot 0.0408 = 0.0816
Double it for a two-sided test.
0.0816 \gt 0.05
Compare the p-value with α.
Answer: with H₀: μ = 8 and Hₐ: μ ≠ 8, the p-value is about 0.0816, so fail to reject H₀. The data don’t give convincing evidence that this school’s mean sleep time differs from 8 hours.
Example 4: Checking the Normal/Large Sample condition
Decide whether a one-sample t-test is safe in each case. (a) A random sample of 40 home prices is strongly right-skewed. (b) A random sample of 12 commute times has one value far above the rest.
40 \ge 30
Compare n in part (a) with 30.
12 \lt 30
Compare n in part (b) with 30.
Answer: (a) Yes. With n ≥ 30, the sampling distribution of x̄ is close to normal even though the data are skewed. (b) No. The sample is small and has an outlier, so the t procedure is not reliable. Look into the outlier or collect more data.
Example 5: Matching a test with an interval
Use the sleep data from Example 3 (x̄ = 7.6, s = 1.1, n = 25). Build a 95% confidence interval for μ. Does it agree with the test?
t^* = \text{invT}(0.975, 24) \approx 2.064Find t* for 95% confidence with df = 24.
\text{ME} = 2.064 \cdot 0.22 \approx 0.4541Multiply t* by SE.
7.6 - 0.4541 = 7.1459
Subtract ME.
7.6 + 0.4541 = 8.0541
Add ME.
Answer: about (7.15, 8.05) hours. The claimed value 8 is inside the interval, so it is plausible. That matches the two-sided test, which failed to reject H₀: μ = 8.
Common mistakes
| Mistake | Example of the error | Fix |
|---|---|---|
| Using z instead of t | Finding the p-value with normalcdf when σ is unknown | Use tcdf with df = n − 1. |
| Wrong degrees of freedom | df = 25 for n = 25 | df = n − 1 = 24. |
| Dividing s by n instead of √n | SE = 1.1/25 = 0.044 | SE = 1.1/√25 = 0.22. |
| Skipping the Normal check for small samples | Using a t-test on 12 values with an outlier | Graph the data; with n < 30, there should be no strong skew or outliers. |
| Concluding about the sample | “The 10 cups average 15.8, so reject.” | Conclude about μ, the mean of all cups. |
Related methods
Paired data
If each observation comes in a matched pair, such as before and after scores for the same student, find the differences first. Then run a one-sample t-test on the differences. That is the paired t-test, the next lesson.
Estimating the mean
A test checks one claimed value. To estimate μ with a range of plausible values, use a confidence interval for a mean. A two-sided test at α = 0.05 and a 95% interval always agree.
Practice problems
- A sample has n = 16 and s = 8. Find the standard error and df.
- Use Problem 1. The sample mean is 103 and H₀: μ = 100. Find t.
- Use Problem 2 with Hₐ: μ > 100. Find the p-value.
- A two-sided test gives t = −2.2 with df = 20. Find the p-value.
- A school says its students read 30 minutes a day on average. Write H₀ and Hₐ to test whether the mean is less than that.
- A company claims its bulbs last 1,200 hours on average. A random sample of 30 bulbs has x̄ = 1,176 hours and s = 60 hours. Test Hₐ: μ < 1,200 at α = 0.05.
- A random sample of 10 test scores has one score far below the rest. Is a one-sample t-test appropriate?
- A one-sample t-test about mean wait time gives a p-value of 0.09 with α = 0.05. Write the conclusion.
- Why does this test use t instead of z?
- Five randomly chosen plants grew 12, 15, 11, 14 and 13 cm. Test H₀: μ = 11 against Hₐ: μ ≠ 11 at α = 0.05. (Assume heights are roughly normal.)
Show answers
1.
\sqrt{16} = 4Take the square root of n.
\text{SE} = \dfrac{8}{4} = 2Divide s by √n.
\text{df} = 16 - 1 = 15Subtract 1 from n.
Answer: SE = 2 and df = 15
2.
103 - 100 = 3
Subtract μ₀ from x̄.
t = \dfrac{3}{2} = 1.5Divide by SE.
Answer: t = 1.5
3.
P(t \ge 1.5) = \text{tcdf}(1.5, 10^{99}, 15) \approx 0.0772Find the right-tail area.
Answer: about 0.0772
4.
P(t \le -2.2) = \text{tcdf}(-10^{99}, -2.2, 20) \approx 0.01986Find one tail.
2 \cdot 0.01986 \approx 0.0397
Double it for a two-sided test.
Answer: about 0.0397
5.
Answer: H₀: μ = 30 and Hₐ: μ < 30, where μ is the true mean daily reading time of the school’s students, in minutes.
6.
\sqrt{30} \approx 5.477Take the square root of n.
\text{SE} = \dfrac{60}{5.477} \approx 10.95Divide s by √n.
1176 - 1200 = -24
Subtract μ₀ from x̄.
t = \dfrac{-24}{10.95} \approx -2.192Divide by SE.
\text{df} = 30 - 1 = 29Subtract 1 from n.
P(t \le -2.192) = \text{tcdf}(-10^{99}, -2.192, 29) \approx 0.0183Find the left-tail area.
0.0183 \lt 0.05
Compare with α.
Answer: p-value ≈ 0.0183, so reject H₀. There is convincing evidence that the bulbs last less than 1,200 hours on average.
7.
10 \lt 30
Compare n with 30.
Answer: No. The sample is small and has an outlier, so the Normal/Large Sample condition fails.
8.
0.09 \gt 0.05
Compare the p-value with α.
Answer: Fail to reject H₀. The data don’t give convincing evidence that the true mean wait time differs from the claimed value.
9.
Answer: The population standard deviation σ is unknown, so we use s. Using s adds uncertainty, and the t-distribution’s heavier tails account for it.
10.
12 + 15 + 11 + 14 + 13 = 65
Add the values.
\bar{x} = \dfrac{65}{5} = 13Divide by n.
1 + 4 + 4 + 1 + 0 = 10
Add the squared deviations from 13.
\dfrac{10}{4} = 2.5Divide by n − 1.
s = \sqrt{2.5} \approx 1.581Take the square root.
\text{SE} = \dfrac{1.581}{\sqrt{5}} \approx 0.7071Divide s by √n.
t = \dfrac{13 - 11}{0.7071} = \dfrac{2}{0.7071}Subtract μ₀ from x̄.
\approx 2.828
Divide by SE.
P(t \ge 2.828) = \text{tcdf}(2.828, 10^{99}, 4) \approx 0.0237Find one tail with df = 4.
2 \cdot 0.0237 = 0.0474
Double it for a two-sided test.
0.0474 \lt 0.05
Compare with α.
Answer: p-value ≈ 0.0474, so reject H₀. There is convincing evidence that the mean height differs from 11 cm (just barely at α = 0.05).
One-sample t-test FAQ
What is the formula for a one-sample t-test?
The test statistic is t = (x̄ − μ₀) ÷ (s/√n), with df = n − 1. The p-value is the matching tail area under the t-distribution with those degrees of freedom.
When do you use a t-test instead of a z-test?
Use a t-test for a mean when the population standard deviation σ is unknown, which is almost always. A z-test for a mean needs σ, which you rarely know.
What are the conditions for a one-sample t-test?
The data must come from a random sample or experiment, the sample must be at most 10% of the population, and the population must be roughly normal or n must be at least 30.
How do you do a one-sample t-test on a TI-84?
Press STAT, choose TESTS, then 2:T-Test. Pick Data or Stats, enter μ₀ and your sample information, choose the direction of Hₐ, then choose Calculate.
Summary
- Use a one-sample t-test to check a claim H₀: μ = μ₀ when σ is unknown.
- t = (x̄ − μ₀) ÷ (s/√n), with df = n − 1.
- Check Random, 10% and Normal/Large Sample (n ≥ 30, or no strong skew or outliers).
- Find the p-value with tcdf in the tail that matches Hₐ, and compare it with α.
- State the conclusion in context about the population mean μ.
Previous lesson: Two-Proportion z-Test
Next lesson: Paired t-Test
Back to the Statistics Index