
P-Values
A p-value is the probability of getting a sample result at least as extreme as the one you observed, assuming the null hypothesis is true. A small p-value means your data would be rare if H₀ were true, so it counts as evidence against H₀. If the p-value is at or below the significance level α, you reject H₀.
Before this lesson: Hypothesis Testing and Normal Probability Calculations
What a p-value measures
Every test starts by assuming H₀ is true. The p-value then asks: in that world, how often would random sampling alone give a result this far from the H₀ value, or farther?
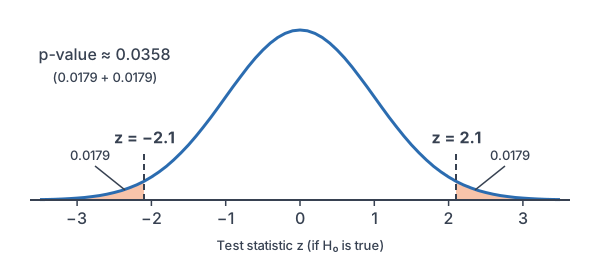
“Extreme” means in the direction of the alternative hypothesis Hₐ. For Hₐ with >, it is the right tail. For <, it is the left tail. For ≠, it is both tails, so you double one tail.
The smaller the p-value, the stronger the evidence against H₀. A p-value is a probability about the data, computed by assuming H₀. It is not the probability that H₀ is true.
How to find and use a p-value
| Alternative | p-value for a z statistic | TI-84 |
|---|---|---|
| H_a: p \gt p_0 | area to the right of z | normalcdf(z, 10^99) |
| H_a: p \lt p_0 | area to the left of z | normalcdf(−10^99, z) |
| H_a: p \ne p_0 | 2 × the tail area beyond z | 2 · normalcdf(|z|, 10^99) |
For a t statistic, use tcdf(lower, upper, df) the same way (see t-distribution).
\text{p-value} \le \alpha \Rightarrow \text{reject } H_0 \qquad \text{p-value} \gt \alpha \Rightarrow \text{fail to reject } H_0How to interpret it: “Assuming H₀ is true, there is a [p-value] probability of getting a sample result as extreme as ours, or more extreme, by chance alone.”
P-value examples
Example 1: A right-tailed p-value
A test of H₀: p = 0.30 against Hₐ: p > 0.30 gives z = 1.5. Find the p-value and make a decision at α = 0.05.
P(Z \ge 1.5) = \text{normalcdf}(1.5, 10^{99})Find the area to the right of z = 1.5.
\approx 0.0668
Read the calculator result.
0.0668 \gt 0.05
Compare the p-value with α.
Answer: the p-value is about 0.0668, which is greater than 0.05, so fail to reject H₀. The data don’t give convincing evidence that p > 0.30.
Example 2: A two-sided p-value
A test of H₀: p = 0.5 against Hₐ: p ≠ 0.5 gives z = −2.1. Find the p-value. What is the decision at α = 0.05? At α = 0.01?
P(Z \le -2.1) = \text{normalcdf}(-10^{99}, -2.1)Find the left-tail area.
\approx 0.0179
Read the calculator result.
2 \cdot 0.0179 = 0.0358
Double it, since both tails count.
0.0358 \lt 0.05
Compare with α = 0.05.
0.0358 \gt 0.01
Compare with α = 0.01.
Answer: the p-value is about 0.0358. Reject H₀ at α = 0.05, but fail to reject at α = 0.01. The same data can lead to different decisions, which is why α is chosen before the test.
Example 3: A p-value from a t statistic
A one-sample t-test of Hₐ: μ > μ₀ gives t = 2.4 with df = 14. Find the p-value.
P(t \ge 2.4) = \text{tcdf}(2.4, 10^{99}, 14)Find the right-tail area with df = 14.
\approx 0.0154
Read the calculator result.
0.0154 \lt 0.05
Compare with α = 0.05.
Answer: the p-value is about 0.0154, so reject H₀ at α = 0.05. A t statistic this large would happen only about 1.5% of the time if H₀ were true.
Example 4: Interpret a p-value (word problem)
A school says 25% of its students bike to school. A student council survey of 200 randomly chosen students finds 62 who bike. Test H₀: p = 0.25 against Hₐ: p > 0.25, and interpret the p-value.
\hat{p} = \dfrac{62}{200} = 0.31Divide bikers by n.
0.25 \cdot 0.75 = 0.1875
Multiply p₀(1 − p₀).
\dfrac{0.1875}{200} = 0.0009375Divide by n.
\text{SE} = \sqrt{0.0009375} \approx 0.03062Take the square root (see square roots).
0.31 - 0.25 = 0.06
Subtract p₀ from p̂.
z = \dfrac{0.06}{0.03062} \approx 1.960Divide by SE.
P(Z \ge 1.960) = \text{normalcdf}(1.960, 10^{99})Find the right-tail area.
\approx 0.025
Read the calculator result.
Answer: the p-value is about 0.025. Interpretation: if 25% of all students at the school bike, there is about a 2.5% chance that a random sample of 200 would show 31% or more bikers. That is rare enough to reject H₀ at α = 0.05.
Example 5: Significant but small
An online store tests whether a new button changes the click rate from p = 0.5. With 40,000 visitors, p̂ = 0.505. Find the two-sided p-value. Does the result matter in practice?
0.5 \cdot 0.5 = 0.25
Multiply p₀(1 − p₀).
\dfrac{0.25}{40000} = 0.00000625Divide by n.
\text{SE} = \sqrt{0.00000625} = 0.0025Take the square root.
z = \dfrac{0.505 - 0.5}{0.0025} = \dfrac{0.005}{0.0025}Subtract p₀ from p̂.
= 2
Divide.
P(Z \ge 2) \approx 0.02275
Find one tail with normalcdf(2, 10^99).
2 \cdot 0.02275 = 0.0455
Double it for a two-sided test.
Answer: the p-value is about 0.0455, so the result is statistically significant at α = 0.05. But the change is only half a percentage point. A huge sample can make a tiny difference significant, so always ask whether the size of the effect matters.
Common mistakes
| Mistake | Example of the error | Fix |
|---|---|---|
| Calling the p-value the chance H₀ is true | “p = 0.03 means a 3% chance H₀ is true” | It is the chance of data this extreme, assuming H₀ is true. |
| Forgetting to double for a two-sided test | Reporting 0.0179 for Hₐ: p ≠ 0.5 | Two-sided p-value = 2 × one tail = 0.0358. |
| Using the wrong tail | Right-tail area for Hₐ: μ < μ₀ | The tail follows the direction of Hₐ. |
| Treating “significant” as “important” | A 0.5-point change with n = 40,000 | Check the size of the effect too. |
| Saying a large p-value proves H₀ | “p = 0.40, so the claim is true” | Fail to reject H₀; the evidence is just not strong. |
Related methods
Comparing p-values with confidence intervals
A p-value says whether the data are consistent with one specific value. A confidence interval shows all the plausible values at once (see confidence intervals). Reporting both gives the clearest picture.
Where p-values come from
Each test has its own test statistic and distribution. The next lesson, One-Proportion z-Test, puts every step together for a single proportion.
Practice problems
- A right-tailed z-test gives z = 1.2. Find the p-value.
- A left-tailed z-test gives z = −2.5. Find the p-value.
- A two-sided z-test gives z = 1.8. Find the p-value.
- A test gives p-value = 0.04. What is the decision at α = 0.05? At α = 0.01?
- A left-tailed t-test gives t = −1.9 with df = 20. Find the p-value.
- A test of whether a coin favors heads gives a p-value of 0.12. Interpret it in context.
- True or false: a p-value of 0.03 means there is a 3% chance that H₀ is true.
- A test gives p-value = 0.027. For which significance levels would you reject H₀?
- A two-sided t-test gives t = 2.6 with df = 11. Find the p-value.
- Which gives stronger evidence against H₀: a p-value of 0.002 or 0.04?
Show answers
1.
P(Z \ge 1.2) = \text{normalcdf}(1.2, 10^{99})Right-tail area.
\approx 0.1151
Read the calculator result.
Answer: about 0.1151
2.
P(Z \le -2.5) = \text{normalcdf}(-10^{99}, -2.5)Left-tail area.
\approx 0.0062
Read the calculator result.
Answer: about 0.0062
3.
P(Z \ge 1.8) = \text{normalcdf}(1.8, 10^{99})One tail beyond z = 1.8.
\approx 0.0359
Read the calculator result.
2 \cdot 0.0359 = 0.0718
Double it for a two-sided test.
Answer: about 0.072
4.
0.04 \lt 0.05
Compare with α = 0.05.
0.04 \gt 0.01
Compare with α = 0.01.
Answer: Reject H₀ at α = 0.05; fail to reject at α = 0.01.
5.
P(t \le -1.9) = \text{tcdf}(-10^{99}, -1.9, 20)Left-tail area with df = 20.
\approx 0.036
Read the calculator result.
Answer: about 0.036
6.
The p-value is computed assuming the coin is fair.
Answer: If the coin is fair, there is a 12% chance of getting at least this many heads by chance alone. That is not unusual, so the data don’t show the coin favors heads.
7.
A p-value is computed by assuming H₀ is true, so it can’t be the probability that H₀ is true.
Answer: False. It is the probability of data this extreme if H₀ is true.
8.
Reject H₀ whenever p-value ≤ α.
Answer: any α of 0.027 or more, such as 0.05 or 0.10 (but not 0.01)
9.
P(t \ge 2.6) = \text{tcdf}(2.6, 10^{99}, 11)One tail with df = 11.
\approx 0.01235
Read the calculator result.
2 \cdot 0.01235 = 0.0247
Double it for a two-sided test.
Answer: about 0.0247
10.
0.002 \lt 0.04
Compare the p-values.
Answer: 0.002. The smaller the p-value, the stronger the evidence against H₀.
P-value FAQ
What does a p-value tell you?
It tells you how likely a result as extreme as yours would be if H₀ were true. A small p-value means the data are hard to explain by chance alone.
What is a good p-value?
There is no single “good” value. A p-value at or below your significance level, usually 0.05, counts as statistically significant. Smaller p-values give stronger evidence against H₀.
How do you find a p-value for a two-tailed test?
Find the tail area beyond your test statistic on one side, then multiply by 2. On a TI-84, use 2 · normalcdf(|z|, 10^99) for a z statistic.
Is a p-value of 0.05 significant?
At α = 0.05, yes: a p-value equal to α leads you to reject H₀. Many researchers also report the exact p-value so readers can judge the strength of the evidence.
Summary
- The p-value is the probability, assuming H₀ is true, of a result at least as extreme as the one observed.
- Use the tail that matches Hₐ; double one tail for a two-sided test.
- If p-value ≤ α, reject H₀; if p-value > α, fail to reject H₀.
- Smaller p-values mean stronger evidence against H₀.
- Statistical significance is not the same as practical importance.
Previous lesson: Hypothesis Testing
Next lesson: One-Proportion z-Test
Back to the Statistics Index