
Confidence Intervals
A confidence interval is a range of plausible values for a population parameter, built from sample data. It has the form point estimate ± margin of error. The confidence level, such as 95%, is how often the method captures the true value over many random samples.
Before this lesson: Sampling Distribution of a Sample Proportion, Sampling Distribution of a Sample Mean and Normal Probability Calculations
What a confidence interval means
A poll finds that 54% of 1,000 voters support a new law. The true share of all voters is probably not exactly 54%. A single number like 0.54 is a point estimate: our best guess, but almost surely a little off.
A confidence interval adds a cushion. The margin of error says how far the estimate is likely to be from the truth. A result like “54% ± 3%” gives the interval from 51% to 57%.
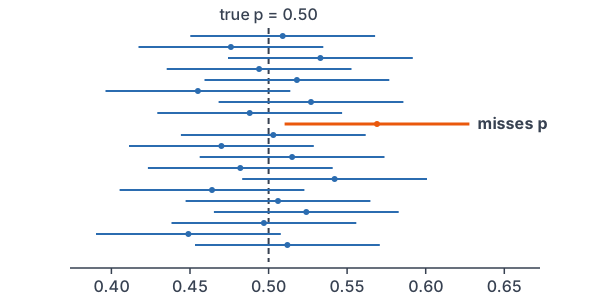
Why does this work? Sample results vary in a known way, as their sampling distribution shows. About 95% of sample proportions land within 1.96 standard deviations of the true p. So if you reach out 1.96 standard deviations from each sample result, about 95% of those intervals will contain p.
Confidence interval formula
\text{estimate} \pm \text{margin of error} = \text{estimate} \pm z^* \cdot \text{SE}- The estimate is the sample statistic, such as p̂ or x̄.
- The critical value z* sets the confidence level. It is the number of standard deviations you reach out.
- SE is the standard error: the standard deviation of the statistic, estimated from the sample.
| Confidence level | Area in each tail | Critical value z* |
|---|---|---|
| 90% | 0.05 | 1.645 |
| 95% | 0.025 | 1.960 |
| 99% | 0.005 | 2.576 |
How to interpret a confidence interval
Use this template: “We are 95% confident that the interval from ___ to ___ captures the true [parameter in context].” For the confidence level, say: “If we took many random samples and built an interval from each, about 95% of the intervals would capture the true value.”
Calculator: to find z* on a TI-84, use invNorm(left area, 0, 1), where the left area is the confidence level plus one tail. In Desmos, use normaldist(0, 1).inversecdf(left area).
Confidence interval examples
Example 1: Build an interval from an estimate
A poll of 1,000 random voters finds p̂ = 0.54 with a margin of error of 0.03 at 95% confidence. Find and interpret the interval.
0.54 - 0.03 = 0.51
Lower endpoint: subtract the margin of error.
0.54 + 0.03 = 0.57
Upper endpoint: add the margin of error.
Answer: (0.51, 0.57). We are 95% confident that the interval from 51% to 57% captures the true share of all voters who support the law.
Example 2: Find the estimate and margin of error
A study reports the 95% confidence interval (12.4, 15.0) for the mean number of hours teens spend online each week. Find the point estimate and the margin of error.
12.4 + 15.0 = 27.4
Add the endpoints.
\dfrac{27.4}{2} = 13.7The estimate is the midpoint, so divide by 2.
15.0 - 12.4 = 2.6
Find the width.
\dfrac{2.6}{2} = 1.3The margin of error is half the width.
Answer: the point estimate is x̄ = 13.7 hours, and the margin of error is 1.3 hours.
Example 3: Find a critical value
Find z* for an 80% confidence interval.
1 - 0.80 = 0.20
Find the total area in the two tails.
\dfrac{0.20}{2} = 0.10Split it evenly between the tails.
0.80 + 0.10 = 0.90
Find the area to the left of z*.
z^* = \text{invNorm}(0.90) \approx 1.282Find the z-score with left area 0.90 (see standard normal distribution).
Answer: z* ≈ 1.282. The z-table gives about 1.28, since P(Z \lt 1.28) = 0.8997.
Example 4: Build an interval from a standard error
A random sample of adult men has mean height x̄ = 68.5 inches, with a standard error of 1.2 inches. Build a 95% confidence interval for the mean height of all adult men.
\text{ME} = 1.96(1.2)Multiply z* by the standard error.
= 2.352
Multiply.
68.5 - 2.352 = 66.148
Lower endpoint: subtract.
68.5 + 2.352 = 70.852
Upper endpoint: add.
Answer: about (66.15, 70.85). We are 95% confident that the interval from 66.15 to 70.85 inches captures the true mean height of adult men.
Example 5: Use an interval to judge a claim (word problem)
A health survey gives a 95% confidence interval of (0.28, 0.36) for the proportion of teens who sleep at least 8 hours on school nights. (a) Find the estimate and margin of error. (b) A website claims that 40% of teens sleep that much. Is the claim plausible? (c) Does the interval mean that 95% of individual teens fall between 0.28 and 0.36?
\dfrac{0.28 + 0.36}{2} = \dfrac{0.64}{2}(a) Estimate: add the endpoints.
= 0.32
Divide by 2.
\dfrac{0.36 - 0.28}{2} = \dfrac{0.08}{2}Margin of error: subtract the endpoints.
= 0.04
Divide by 2.
0.40 \gt 0.36
(b) Compare the claim with the upper endpoint.
Answer: (a) p̂ = 0.32, with margin of error 0.04. (b) No. 0.40 is outside the interval, so 40% is not a plausible value. (c) No. The interval estimates one number, the proportion of all teens who sleep at least 8 hours. It says nothing about individual teens.
Common mistakes
| Mistake | Example of the error | Fix |
|---|---|---|
| Saying there is a 95% chance p is in this interval | “P(0.51 ≤ p ≤ 0.57) = 0.95” | p is fixed. Say “we are 95% confident the interval captures p.” |
| Saying 95% of the data fall in the interval | “95% of teens sleep in this range” | The interval estimates a parameter, not where individual values fall. |
| Using the wrong tail area for z* | Using invNorm(0.95) for a 95% interval | For 95%, the left area is 0.975, so z* = 1.96. |
| Thinking a higher level gives a narrower interval | “99% is more precise than 95%” | Higher confidence needs a larger z*, so the interval gets wider. |
| Forgetting context | “We are 95% confident p is between 0.51 and 0.57” | Say what p is: the true share of all voters who support the law. |
Related methods
What changes the width
The margin of error is z* times SE. A higher confidence level makes z* larger, so the interval widens. A larger sample makes SE smaller, so the interval narrows. Because SE has √n in the denominator, you need 4 times the sample size to cut the margin of error in half.
Specific intervals
The next lessons build the confidence interval for a proportion, using p̂ and \sqrt{\hat{p}(1 - \hat{p})/n}, and for a mean (see confidence interval for a mean), using x̄ and a t critical value. Both rest on the central limit theorem and the conditions you check for sampling distributions.
Practice problems
- A poll finds p̂ = 0.62 with margin of error 0.04. Write the confidence interval.
- A confidence interval is (0.41, 0.49). Find the point estimate and the margin of error.
- A confidence interval for a mean is (22.6, 27.0). Find the point estimate and the margin of error.
- Find z* for a 99% confidence interval.
- A sample has x̄ = 40 with standard error 2.5. Build a 90% confidence interval for μ.
- What happens to the width of an interval when the confidence level changes from 95% to 99%?
- The sample size is multiplied by 4, and the confidence level stays the same. What happens to the margin of error?
- A student says, “There is a 95% probability that μ is between 12 and 18.” Explain the mistake.
- A 95% interval for a proportion is (0.28, 0.36). Is 0.30 a plausible value of p?
- Fifty different random samples each give a 95% confidence interval. About how many of the intervals should capture the true parameter?
Show answers
1.
0.62 - 0.04 = 0.58
Lower endpoint: subtract.
0.62 + 0.04 = 0.66
Upper endpoint: add.
Answer: (0.58, 0.66)
2.
\dfrac{0.41 + 0.49}{2} = \dfrac{0.90}{2}Estimate: add the endpoints.
= 0.45
Divide by 2.
\dfrac{0.49 - 0.41}{2} = \dfrac{0.08}{2}Margin of error: subtract the endpoints.
= 0.04
Divide by 2.
Answer: estimate 0.45, margin of error 0.04
3.
\dfrac{22.6 + 27.0}{2} = \dfrac{49.6}{2}Estimate: add the endpoints.
= 24.8
Divide by 2.
\dfrac{27.0 - 22.6}{2} = \dfrac{4.4}{2}Margin of error: subtract the endpoints.
= 2.2
Divide by 2.
Answer: estimate 24.8, margin of error 2.2
4.
1 - 0.99 = 0.01
Find the total area in the two tails.
\dfrac{0.01}{2} = 0.005Split it evenly between the tails.
0.99 + 0.005 = 0.995
Find the area to the left of z*.
z^* = \text{invNorm}(0.995) \approx 2.576Find the z-score.
Answer: z* ≈ 2.576
5.
\text{ME} = 1.645(2.5) = 4.1125For 90%, z* = 1.645; multiply by SE.
40 - 4.1125 = 35.8875
Lower endpoint: subtract.
40 + 4.1125 = 44.1125
Upper endpoint: add.
Answer: about (35.89, 44.11)
6.
2.576 \gt 1.96
Compare the critical values.
Answer: the interval gets wider, because z* is larger
7.
\dfrac{\sigma}{\sqrt{4n}} = \dfrac{\sigma}{2\sqrt{n}}\sqrt{4} = 2, so SE is cut in half.
Answer: the margin of error is cut in half
8.
μ is a fixed number, so it is either in the interval or not. The 95% describes the method: about 95% of intervals built this way capture μ.
Answer: say “we are 95% confident the interval from 12 to 18 captures μ”
9.
0.28 \lt 0.30 \lt 0.36
Check whether 0.30 is between the endpoints.
Answer: yes, 0.30 is inside the interval
10.
0.95(50) = 47.5
Multiply the confidence level by the number of intervals.
Answer: about 47 or 48 intervals
Confidence interval FAQ
What does a 95% confidence interval mean?
If you took many random samples and built a 95% interval from each one, about 95% of the intervals would capture the true parameter. For one interval, you say you are 95% confident it captures the parameter.
What is the margin of error?
It is the critical value times the standard error. It is half the width of the interval and shows how far the estimate is likely to be from the true value.
Why is 1.96 used for 95% confidence?
In a standard normal distribution, 95% of the area lies between z = −1.96 and z = 1.96. So 1.96 standard errors on each side captures the middle 95%.
Does a wider interval mean more confidence?
For the same data, yes. A higher confidence level uses a larger critical value, which makes the interval wider. More confidence costs precision.
Summary
- A confidence interval is estimate ± margin of error, where the margin of error is z* times SE.
- The estimate is the midpoint of the interval, and the margin of error is half its width.
- The confidence level is the long-run capture rate of the method, not the chance that one interval is right.
- Interpret in context: “We are 95% confident that the interval from ___ to ___ captures the true ___.”
- Higher confidence widens the interval; a larger sample narrows it.
Previous lesson: Sampling Distributions for Differences
Next lesson: Confidence Interval for a Proportion
Back to the Statistics Index