
Standard Normal Distribution
The standard normal distribution is the normal distribution with mean 0 and standard deviation 1, written N(0, 1). Its values are z-scores. A z-table or a calculator gives the area to the left of any z. From that, you can find the area to the right of z or between two z-scores.
Before this lesson: Normal Distribution, Empirical Rule and Percentiles and Z-Scores
Why one curve is enough
Every normal curve has the same shape. A z-score tells how many standard deviations a value is from its mean. When you change every value to a z-score, any normal distribution becomes the same curve: N(0, 1).
So one table of areas works for every normal distribution. The standard normal curve is a density curve, so its areas are probabilities. Its center, z = 0, is both the mean and the median, and its standard deviation is 1.
How to read a z-table
A z-table lists the area to the left of z, which is P(Z \lt z). The rows give z to one decimal place. The columns give the second decimal place.
- Split z into its row and column. For z = 1.25, the row is 1.2 and the column is .05.
- Read the area where the row and column meet: 0.8944.
- For a right area, subtract from 1: P(Z \gt z) = 1 - P(Z \lt z).
- For an area between two z-scores, subtract the two left areas: P(a \lt Z \lt b) = P(Z \lt b) - P(Z \lt a).
Part of the z-table (areas to the left of z)
| z | .00 | .04 | .05 | .08 | .09 |
|---|---|---|---|---|---|
| −2.0 | 0.0228 | 0.0207 | 0.0202 | 0.0188 | 0.0183 |
| −1.3 | 0.0968 | 0.0901 | 0.0885 | 0.0838 | 0.0823 |
| −1.0 | 0.1587 | 0.1492 | 0.1469 | 0.1401 | 0.1379 |
| −0.8 | 0.2119 | 0.2005 | 0.1977 | 0.1894 | 0.1867 |
| −0.6 | 0.2743 | 0.2611 | 0.2578 | 0.2483 | 0.2451 |
| 0.8 | 0.7881 | 0.7995 | 0.8023 | 0.8106 | 0.8133 |
| 1.0 | 0.8413 | 0.8508 | 0.8531 | 0.8599 | 0.8621 |
| 1.2 | 0.8849 | 0.8925 | 0.8944 | 0.8997 | 0.9015 |
| 1.6 | 0.9452 | 0.9495 | 0.9505 | 0.9535 | 0.9545 |
| 2.0 | 0.9772 | 0.9793 | 0.9798 | 0.9812 | 0.9817 |
| 2.1 | 0.9821 | 0.9838 | 0.9842 | 0.9854 | 0.9857 |
For a negative z, the row is negative too, and the column still adds to the size of z. For z = −0.68, use row −0.6 and column .08.
Calculator: on a TI-84, press 2nd, VARS (DISTR) and choose normalcdf. Enter the lower bound, the upper bound, μ = 0 and σ = 1. For a left area, use a very small lower bound such as −1E99. In Desmos, type normaldist(0, 1).cdf(a, b) for the area between a and b.
Standard normal distribution examples
Example 1: Area to the left of z
Find P(Z \lt 1.25).
1.25 = 1.2 + 0.05
Split z into its row (1.2) and its column (.05).
P(Z \lt 1.25) = 0.8944
Read the table at row 1.2, column .05.
Answer: P(Z \lt 1.25) = 0.8944. Calculator check: normalcdf(−1E99, 1.25, 0, 1) ≈ 0.8944.
Example 2: Area to the right of z
Find P(Z \gt -0.68).
P(Z \lt -0.68) = 0.2483
Read the table at row −0.6, column .08.
P(Z \gt -0.68) = 1 - 0.2483
The table gives left areas, so subtract from the total area of 1 (see complement rule).
= 0.7517
Subtract.
Answer: P(Z \gt -0.68) = 0.7517. This makes sense: −0.68 is left of the center, so more than half of the area is to its right.
Example 3: Area between two z-scores
Find P(-1.30 \lt Z \lt 0.85).
P(Z \lt 0.85) = 0.8023
Left area for the upper z: row 0.8, column .05.
P(Z \lt -1.30) = 0.0968
Left area for the lower z: row −1.3, column .00.
P(-1.30 \lt Z \lt 0.85) = 0.8023 - 0.0968
Subtract the smaller left area from the larger one.
= 0.7055
Subtract.
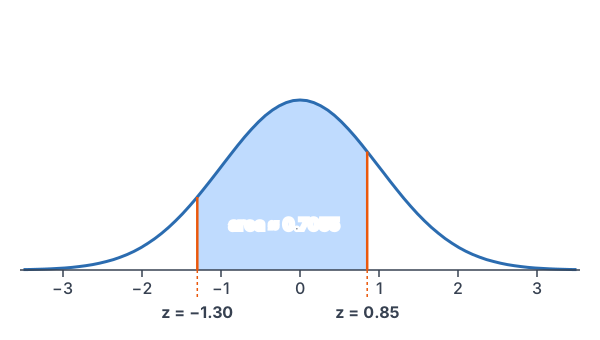
Answer: about 0.7055. On a TI-84, normalcdf(−1.30, 0.85, 0, 1) ≈ 0.7055. In Desmos, normaldist(0, 1).cdf(−1.3, 0.85) gives the same value.
Example 4: Test scores reported as z-scores (word problem)
A state reading test has scores that are approximately normal, and each student’s report gives a z-score. Leo’s z-score is 2.10. What proportion of students scored higher than Leo? About what percentile is he at?
P(Z \lt 2.10) = 0.9821
Read the table at row 2.1, column .00.
P(Z \gt 2.10) = 1 - 0.9821
Higher than Leo means the area to the right.
= 0.0179
Subtract.
Answer: about 0.0179, or 1.79%, scored higher. About 98.21% scored lower, so Leo is at about the 98th percentile.
Example 5: Find z from an area
(a) Find the z-score with 90% of the area to its left. (b) Find the z-score that cuts off the top 5%.
0.8997 \text{ at } z = 1.28(a) Look inside the table for the area closest to 0.9000: row 1.2, column .08 is 0.0003 away.
0.9015 \text{ at } z = 1.29Row 1.2, column .09 is 0.0015 away, so 1.28 is closer.
1 - 0.05 = 0.95
(b) The top 5% has 95% of the area to its left.
0.9495 \text{ at } z = 1.64Find the table areas on each side of 0.95: row 1.6, column .04.
0.9505 \text{ at } z = 1.65Row 1.6, column .05.
z \approx 1.645
0.95 is halfway between, so use the z halfway between.
Answer: (a) z ≈ 1.28; (b) z ≈ 1.645. On a TI-84, invNorm(0.90, 0, 1) ≈ 1.2816 and invNorm(0.95, 0, 1) ≈ 1.6449. The invNorm command always uses the area to the left.
Common mistakes
| Mistake | Example of the error | Fix |
|---|---|---|
| Using a left area as a right area | P(Z > 1.25) = 0.8944 | The table gives left areas: 1 − 0.8944 = 0.1056. |
| Subtracting in the wrong order | 0.0968 − 0.8023 for the area between −1.30 and 0.85 | Subtract the smaller left area from the larger: 0.7055. |
| Reading the wrong column | Using column .02 for z = 1.25 | The second decimal picks the column: .05. |
| Looking up a raw score | Looking up 130 in the z-table | Change the value to a z-score first. |
| Dropping the negative sign | Using row 0.6 for z = −0.68 | Use row −0.6: P(Z < −0.68) = 0.2483. |
| Giving an area when z is asked | Answering 0.90 for the z with 90% to its left | Find 0.90 inside the table and read z = 1.28. |
Related methods
Any normal distribution
For a normal variable with any mean and standard deviation, first change each value to a z-score with z = \dfrac{x - \mu}{\sigma}. Then use the table. That is the next lesson, Normal Probability Calculations.
Check with the empirical rule
The table agrees with the empirical rule. The area between z = −1 and z = 1 is 0.8413 − 0.1587 = 0.6826, close to 68%.
Practice problems
Use the table above or a calculator.
- Find P(Z \lt 0.85).
- Find P(Z \gt 1.25).
- Find P(Z \lt -1.30).
- Find P(-0.68 \lt Z \lt 1.25).
- Find P(Z \gt -1.30).
- Find P(-2 \lt Z \lt 2). Compare it with the empirical rule.
- Find P(1.20 \lt Z \lt 2.10).
- Find the z-score with 20% of the area to its left.
- Find the z-score that cuts off the top 10%.
- Fitness test results are reported as z-scores. What proportion of students have z-scores between −1 and 1?
Show answers
1.
P(Z \lt 0.85) = 0.8023
Read the table at row 0.8, column .05.
Answer: 0.8023
2.
P(Z \lt 1.25) = 0.8944
Read row 1.2, column .05.
P(Z \gt 1.25) = 1 - 0.8944
Subtract the left area from 1.
= 0.1056
Subtract.
Answer: 0.1056
3.
P(Z \lt -1.30) = 0.0968
Read row −1.3, column .00.
Answer: 0.0968
4.
P(Z \lt 1.25) = 0.8944
Left area for the upper z.
P(Z \lt -0.68) = 0.2483
Left area for the lower z.
0.8944 - 0.2483 = 0.6461
Subtract the smaller left area from the larger.
Answer: 0.6461
5.
P(Z \lt -1.30) = 0.0968
Read row −1.3, column .00.
P(Z \gt -1.30) = 1 - 0.0968
Subtract the left area from 1.
= 0.9032
Subtract.
Answer: 0.9032
6.
P(Z \lt 2) = 0.9772
Read row 2.0, column .00.
P(Z \lt -2) = 0.0228
Read row −2.0, column .00.
0.9772 - 0.0228 = 0.9544
Subtract.
Answer: 0.9544, close to the empirical rule’s 95%
7.
P(Z \lt 2.10) = 0.9821
Read row 2.1, column .00.
P(Z \lt 1.20) = 0.8849
Read row 1.2, column .00.
0.9821 - 0.8849 = 0.0972
Subtract.
Answer: 0.0972
8.
0.2005 \text{ at } z = -0.84Find the area closest to 0.2000: row −0.8, column .04 is 0.0005 away.
0.1977 \text{ at } z = -0.85Row −0.8, column .05 is 0.0023 away, so −0.84 is closer.
Answer: z ≈ −0.84 (invNorm(0.20, 0, 1) ≈ −0.8416)
9.
1 - 0.10 = 0.90
The top 10% has 90% of the area to its left.
z \approx 1.28
From Example 5, 0.8997 is the closest table area.
Answer: z ≈ 1.28
10.
P(Z \lt 1) = 0.8413
Read row 1.0, column .00.
P(Z \lt -1) = 0.1587
Read row −1.0, column .00.
0.8413 - 0.1587 = 0.6826
Subtract.
Answer: about 0.6826
Standard normal distribution FAQ
What is the standard normal distribution?
It is the normal distribution with mean 0 and standard deviation 1. Its values are z-scores, and its areas come from a z-table or a calculator.
How do you read a z-table?
Find the row for the first decimal of z and the column for the second decimal. The number where they meet is the area to the left of z.
What is the area to the left of z = 0?
It is 0.5. The curve is symmetric about 0, so half of the area is on each side.
How do you find the area between two z-scores?
Find the left area for each z-score. Then subtract the smaller one from the larger one.
Summary
- The standard normal distribution is N(0, 1), and its values are z-scores.
- A z-table gives the area to the left of z.
- Right area: 1 minus the left area. Area between: the larger left area minus the smaller one.
- To find z from an area, look for the area inside the table, or use invNorm.
- On a TI-84, normalcdf finds areas. In Desmos, normaldist(0, 1).cdf finds them.
Previous lesson: Empirical Rule
Next lesson: Normal Probability Calculations
Back to the Statistics Index