
Density Curves
A density curve is a curve that describes the distribution of a continuous variable. It always lies on or above the horizontal axis, and the total area under it is exactly 1. The area under the curve over an interval is the proportion of values, or the probability, in that interval.
Before this lesson: Dot Plots and Histograms, Describing a Distribution and Discrete Random Variables
From histograms to density curves
A relative frequency histogram shows the proportion of values in each bar. Now imagine a huge data set with very thin bars. The tops of the bars smooth out into a curve. That curve is a density curve.
A density curve models a continuous random variable, which can take any value in an interval, such as a time or a height. For a discrete random variable, the bar heights are probabilities. For a continuous one, areas are probabilities.
Because a single point has no width, the area above one exact value is 0. So for a continuous variable, P(X = a) = 0, and P(X \lt a) is the same as P(X \le a).
Density curve rules
A curve is a valid density curve when both rules hold:
- It is on or above the horizontal axis everywhere.
- The total area under it is exactly 1.
Then, for any interval:
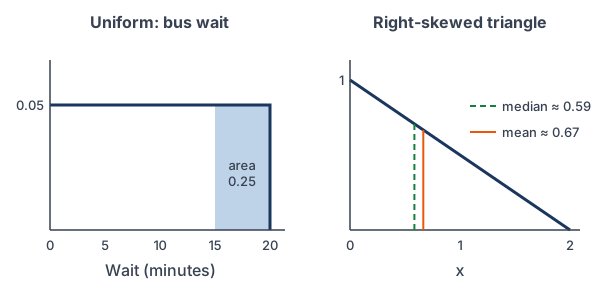
P(a \le X \le b) = \text{area under the curve from } a \text{ to } bThe median of a density curve is the point that splits the area in half. The mean is the balance point, the point where the curve would balance if it were made of solid material. In a symmetric curve they are equal. In a skewed curve, the mean is pulled farther toward the long tail than the median.
A uniform distribution has a flat density curve: every interval of the same width has the same probability. For a uniform curve from a to b, the height is \dfrac{1}{b - a}, so the rectangle’s area is 1.
Density curve examples
Example 1: Area under a uniform density curve
X has a uniform distribution from 0 to 5. Find the height of the density curve and P(1 \le X \le 3).
\text{height} = \dfrac{1}{5 - 0}The rectangle’s area must be 1.
= 0.2
Divide.
\text{width} = 3 - 1 = 2Find the width of the interval.
P(1 \le X \le 3) = 2(0.2)
Area of a rectangle is width times height (see area of rectangles).
= 0.4
Multiply.
Answer: the height is 0.2, and P(1 \le X \le 3) = 0.4.
Example 2: Waiting for a bus (word problem)
A bus comes every 20 minutes, so a rider’s wait X is uniform from 0 to 20 minutes. Find the probability that the wait is more than 15 minutes, and the probability that it is exactly 7 minutes.
\text{height} = \dfrac{1}{20} = 0.05Find the height of the uniform curve.
\text{width} = 20 - 15 = 5More than 15 minutes runs from 15 to 20.
P(X \gt 15) = 5(0.05)
Width times height.
= 0.25
Multiply.
P(X = 7) = 0
One exact value has no width, so its area is 0.
Answer: P(X \gt 15) = 0.25 and P(X = 7) = 0. The left graph above shows the shaded area.
Example 3: Is it a valid density curve?
(a) A curve has height 0.4 from x = 0 to x = 2 and height 0 elsewhere. Is it a valid density curve? (b) What height would make a flat curve from 0 to 4 valid?
2(0.4) = 0.8
(a) Find the total area of the rectangle.
0.8 \ne 1
The total area must be 1, so the curve is not valid.
4h = 1
(b) Set the area equal to 1.
h = \dfrac{1}{4} = 0.25Divide both sides by 4.
Answer: (a) no, because the area is 0.8; (b) a height of 0.25.
Example 4: A triangular density curve
A density curve starts at height 1 at x = 0 and falls in a straight line to height 0 at x = 2, so f(x) = 1 - \dfrac{x}{2} for 0 \le x \le 2. Check that it is valid, find P(X \le 1), and find the median.
\dfrac{1}{2}(2)(1) = 1Total area of the triangle (see area of triangles).
f(1) = 1 - \dfrac{1}{2} = 0.5Find the height at x = 1.
P(X \le 1) = \dfrac{1 + 0.5}{2} \cdot 1The region from 0 to 1 is a trapezoid (see area of trapezoids).
= 0.75
Multiply.
\dfrac{1}{2}(2 - m)\left(1 - \dfrac{m}{2}\right) = \dfrac{(2 - m)^2}{4}Area to the right of the median m is a small triangle.
\dfrac{(2 - m)^2}{4} = 0.5The median leaves half the area on each side.
(2 - m)^2 = 2
Multiply both sides by 4.
2 - m = \sqrt{2}Take the positive square root, since m is less than 2 (see solving quadratics with square roots).
m = 2 - \sqrt{2} \approx 0.59Solve for m.
Answer: the area is 1, so it is valid; P(X \le 1) = 0.75; the median is about 0.59. The mean of this curve is 2/3, about 0.67. It is to the right of the median because the curve has a long right tail.
Example 5: Package delivery window (word problem)
A package arrives at a random time between 1:00 and 3:00 p.m., with every time equally likely. Find the probability that it arrives between 1:30 and 2:15 p.m., and the probability that it arrives after 2:40 p.m.
3{:}00 - 1{:}00 = 120 \text{ min}Measure time in minutes after 1:00.
\text{height} = \dfrac{1}{120}Height of the uniform curve.
2{:}15 - 1{:}30 = 45 \text{ min}Width of the first interval.
\dfrac{45}{120} = 0.375Width times height, then simplify.
3{:}00 - 2{:}40 = 20 \text{ min}Width of the second interval.
\dfrac{20}{120} = \dfrac{1}{6} \approx 0.1667Width times height.
Answer: 0.375 for 1:30 to 2:15, and about 0.1667 for after 2:40. The mean and the median are both 2:00 p.m., because the curve is symmetric.
Common mistakes
| Mistake | Example of the error | Fix |
|---|---|---|
| Reading the height as the probability | P(X = 7) = 0.05 for the bus wait | Heights aren’t probabilities; P(X = 7) = 0. |
| Forgetting that the total area is 1 | Using height 1 for a uniform curve from 0 to 20 | Height = 1/(20 − 0) = 0.05. |
| Treating “less than” and “at most” differently | P(X < 15) ≠ P(X ≤ 15) | For a continuous variable they are equal. |
| Putting the mean on the wrong side | Mean to the left of the median in a right-skewed curve | The mean is pulled toward the long tail. |
| Using the peak as the median | Median of the triangle = 0, where the curve is highest | The median splits the area in half: about 0.59. |
| Allowing negative heights | A curve that dips below the axis | A density curve is never below the axis. |
Related methods
Shape, center and spread
Describe a density curve the same way as data in describing a distribution: shape, center and spread. The mean and median of a curve match the ideas in mean, median, mode and range.
Areas with calculus
For curves that aren’t made of rectangles and triangles, the area comes from a definite integral. In this course you will use tables and calculators instead. The most important density curve is the bell-shaped normal curve, the topic of the next lesson, Normal Distribution.
Practice problems
- X is uniform from 0 to 10. Find the height of its density curve.
- Use Problem 1. Find P(2 ≤ X ≤ 7).
- Use Problem 1. Find P(X > 8.5).
- Use Problem 1. Find P(X = 4).
- A curve has height 0.5 from x = 0 to x = 3. Is it a valid density curve?
- X is uniform from 2 to 6. Find the height and P(X < 3).
- Use the triangular curve f(x) = 1 − x/2 from Example 4. Find P(X > 1).
- A density curve is skewed left. Which is larger, the mean or the median?
- Use the delivery window in Example 5. Find the probability that the package arrives before 1:20 p.m.
- X is uniform from 0 to 4. Find the mean and the median.
Show answers
1.
\dfrac{1}{10 - 0} = 0.1The area of the rectangle must be 1.
Answer: 0.1
2.
7 - 2 = 5
Width of the interval.
5(0.1) = 0.5
Width times height.
Answer: 0.5
3.
10 - 8.5 = 1.5
Width from 8.5 to 10.
1.5(0.1) = 0.15
Width times height.
Answer: 0.15
4.
\text{width} = 0One exact value has no width.
Answer: 0
5.
3(0.5) = 1.5
Total area.
1.5 \ne 1
The area must be 1.
Answer: no, the area is 1.5
6.
\dfrac{1}{6 - 2} = 0.25Height.
(3 - 2)(0.25) = 0.25
Width times height.
Answer: height 0.25; P(X < 3) = 0.25
7.
\dfrac{1}{2}(1)(0.5) = 0.25The region from 1 to 2 is a triangle with base 1 and height 0.5.
1 - 0.75 = 0.25
Check with the complement of Example 4.
Answer: 0.25
8.
\text{left tail pulls the mean left}The mean is pulled toward the long tail.
Answer: the median is larger
9.
\dfrac{20}{120} = \dfrac{1}{6}From 1:00 to 1:20 is 20 minutes.
\dfrac{1}{6} \approx 0.1667Divide.
Answer: about 0.1667
10.
\dfrac{0 + 4}{2} = 2A uniform curve is symmetric, so the mean and median are at the center.
Answer: mean 2 and median 2
Density curve FAQ
What is a density curve in statistics?
It is a curve on or above the horizontal axis with a total area of 1 under it. Areas under the curve give the proportions, or probabilities, for intervals of values.
Why is the probability of one exact value 0?
A single value is a line with no width, so the area above it is 0. Only intervals have positive probability for a continuous variable.
Where is the median of a density curve?
The median is the value that splits the area under the curve in half: 0.5 to its left and 0.5 to its right.
How do you find the height of a uniform distribution?
Divide 1 by the width of the interval. A uniform curve from a to b has height 1/(b − a).
Summary
- A density curve is on or above the axis, and the total area under it is 1.
- Area over an interval = proportion or probability for that interval.
- For a continuous variable, P(X = a) = 0, so “less than” and “at most” give the same probability.
- The median splits the area in half; the mean is the balance point and is pulled toward a long tail.
- A uniform curve from a to b has height 1/(b − a).
Previous lesson: Geometric Distribution
Next lesson: Normal Distribution
Back to the Statistics Index