
Empirical Rule
The empirical rule, also called the 68-95-99.7 rule, says that in a normal distribution about 68% of values fall within 1 standard deviation of the mean, about 95% fall within 2, and about 99.7% fall within 3. It lets you estimate percents and probabilities without a table.
Before this lesson: Normal Distribution, Standard Deviation and Percentiles and Z-Scores
What the empirical rule means
Every normal curve has the same shape. Only its center and its width change. So the share of the area within 1, 2 or 3 standard deviations of the mean is the same for every normal curve.
That gives a quick way to read a normal distribution. If a histogram of data is close to a bell shape, you can use these shares for the data too.
The 68-95-99.7 rule
- About 68% of values are between μ − σ and μ + σ.
- About 95% of values are between μ − 2σ and μ + 2σ.
- About 99.7% of values are between μ − 3σ and μ + 3σ.
Because the curve is symmetric, you can split these shares into pieces:
\dfrac{68\%}{2} = 34\%From the mean to 1σ on one side.
\dfrac{95\% - 68\%}{2} = 13.5\%From 1σ to 2σ on one side.
\dfrac{99.7\% - 95\%}{2} = 2.35\%From 2σ to 3σ on one side.
\dfrac{100\% - 99.7\%}{2} = 0.15\%Beyond 3σ on one side.
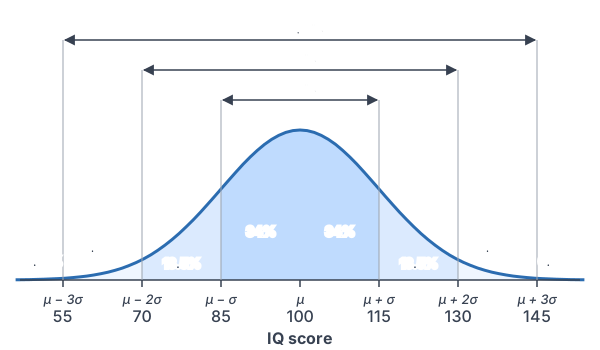
To use the rule, first find how many standard deviations a value is from the mean. Then add the pieces between your two values.
Empirical rule examples
Example 1: Find the middle 68%, 95% and 99.7%
IQ scores are approximately normal with mean 100 and standard deviation 15. Find the intervals that hold the middle 68%, 95% and 99.7% of scores.
100 \pm 15 = 85 \text{ and } 115Subtract and add one standard deviation: about 68%.
2(15) = 30
Find two standard deviations.
100 \pm 30 = 70 \text{ and } 130Subtract and add: about 95%.
3(15) = 45
Find three standard deviations.
100 \pm 45 = 55 \text{ and } 145Subtract and add: about 99.7%.
Answer: about 68% of scores are from 85 to 115, about 95% are from 70 to 130, and about 99.7% are from 55 to 145.
Example 2: Find a tail percent
Use the IQ scores from Example 1. About what percent of scores are above 130? About what percent are below 85?
130 = 100 + 2(15)
130 is 2 standard deviations above the mean.
100\% - 95\% = 5\%
About 5% is outside 70 to 130 (see complement rule).
\dfrac{5\%}{2} = 2.5\%By symmetry, half of that is in the upper tail.
85 = 100 - 15
85 is 1 standard deviation below the mean.
100\% - 68\% = 32\%
About 32% is outside 85 to 115.
\dfrac{32\%}{2} = 16\%Half of that is in the lower tail.
Answer: about 2.5% of scores are above 130, and about 16% are below 85.
Example 3: Add the pieces
Use the IQ scores again. About what percent of scores are between 85 and 130?
85 = 100 - 15
85 is 1 standard deviation below the mean.
130 = 100 + 2(15)
130 is 2 standard deviations above the mean.
34\% + 34\% + 13.5\%
Add the pieces from −σ to +2σ.
= 81.5\%
Add.
Answer: about 81.5% of scores are between 85 and 130.
Example 4: Light bulbs (word problem)
A store gets 2,000 light bulbs. Their lifetimes are approximately normal with mean 1,200 hours and standard deviation 80 hours. About how many bulbs will last less than 1,040 hours?
1200 - 1040 = 160
Find the distance below the mean.
\dfrac{160}{80} = 2Divide by σ: 1,040 is 2 standard deviations below.
100\% - 95\% = 5\%
Both tails beyond 2σ.
\dfrac{5\%}{2} = 2.5\%Keep only the lower tail.
0.025(2000) = 50
Find 2.5% of 2,000 bulbs (see percent of a number).
Answer: about 50 bulbs.
Example 5: Work backward to find μ and σ (word problem)
Commute times in a city are approximately normal. The middle 95% of commutes take between 18 and 42 minutes. Find the mean and standard deviation. Then find about what percent of commutes take more than 36 minutes.
\mu = \dfrac{18 + 42}{2}The middle 95% is centered on the mean.
= \dfrac{60}{2}Add.
= 30
Divide.
42 - 30 = 12
Distance from the mean to the upper edge.
2\sigma = 12
The 95% edges are 2 standard deviations from the mean.
\sigma = 6
Divide both sides by 2.
36 = 30 + 6
36 is 1 standard deviation above the mean.
100\% - 68\% = 32\%
Both tails beyond 1σ.
\dfrac{32\%}{2} = 16\%Keep only the upper tail.
Answer: μ = 30 minutes and σ = 6 minutes. About 16% of commutes take more than 36 minutes.
Common mistakes
| Mistake | Example of the error | Fix |
|---|---|---|
| Using the rule on skewed data | Using 68-95-99.7 for household incomes | Use it only when the distribution is close to normal. |
| Forgetting to split a tail in half | Saying 5% of IQ scores are above 130 | The 5% outside is split: 2.5% in each tail. |
| Mixing up the pieces | Saying 13.5% is between 100 and 115 | From μ to μ + σ is 34%. From μ + σ to μ + 2σ is 13.5%. |
| Treating the rule as exact | Saying exactly 95% are within 2σ | The exact share is about 95.45%. The rule rounds. |
| Giving a percent when a count is asked | Answering 2.5% for the bulb question | Multiply: 0.025(2,000) = 50 bulbs. |
| Using the rule between whole σ marks | Using the rule for 1.3σ above the mean | Use a z-table or a calculator for values between the marks. |
Related methods
Values between the marks
The empirical rule only works at whole numbers of standard deviations. For a value like 1.3σ above the mean, find its z-score and use the standard normal table. That is the next lesson, Standard Normal Distribution.
Unusual values and skewed data
A value more than 2σ from the mean happens only about 5% of the time, so it is often called unusual. For data that are skewed, use the 1.5 × IQR rule to find outliers instead.
Practice problems
- X is N(50, 4). About what percent of values are between 46 and 54?
- X is N(50, 4). About what percent of values are between 42 and 58?
- X is N(50, 4). About what percent of values are above 58?
- X is N(50, 4). About what percent of values are below 46?
- X is N(50, 4). About what percent of values are between 50 and 62?
- X is N(50, 4). About what percent of values are between 42 and 54?
- Adult men’s heights are approximately N(69, 3) inches. About what percent of men are taller than 75 inches?
- A test was taken by 600 students. Scores are approximately N(75, 10). About how many students scored between 65 and 95?
- About 99.7% of a normal variable’s values are between 12 and 48. Find μ and σ.
- Use the heights in Problem 7. About what height is at the 84th percentile?
Show answers
1.
50 \pm 4 = 46 \text{ and } 5446 and 54 are 1 standard deviation from the mean.
Answer: about 68%
2.
2(4) = 8
Two standard deviations.
50 \pm 8 = 42 \text{ and } 5842 and 58 are 2 standard deviations from the mean.
Answer: about 95%
3.
100\% - 95\% = 5\%
58 is 2σ above the mean, and 5% is outside 2σ.
\dfrac{5\%}{2} = 2.5\%Keep only the upper tail.
Answer: about 2.5%
4.
100\% - 68\% = 32\%
46 is 1σ below the mean, and 32% is outside 1σ.
\dfrac{32\%}{2} = 16\%Keep only the lower tail.
Answer: about 16%
5.
62 = 50 + 3(4)
62 is 3 standard deviations above the mean.
34\% + 13.5\% + 2.35\%
Add the pieces from μ to μ + 3σ.
= 49.85\%
Add.
Answer: about 49.85%
6.
42 = 50 - 2(4)
42 is 2 standard deviations below the mean.
54 = 50 + 4
54 is 1 standard deviation above the mean.
13.5\% + 34\% + 34\%
Add the pieces from μ − 2σ to μ + σ.
= 81.5\%
Add.
Answer: about 81.5%
7.
75 - 69 = 6
Distance above the mean.
\dfrac{6}{3} = 275 is 2 standard deviations above.
100\% - 95\% = 5\%
About 5% is outside 2σ.
\dfrac{5\%}{2} = 2.5\%Keep only the upper tail.
Answer: about 2.5%
8.
65 = 75 - 10 \text{ and } 95 = 75 + 2(10)From 1σ below to 2σ above the mean.
34\% + 34\% + 13.5\% = 81.5\%
Add the pieces.
0.815(600) = 489
Find 81.5% of 600.
Answer: about 489 students
9.
\mu = \dfrac{12 + 48}{2}The middle 99.7% is centered on the mean.
= \dfrac{60}{2}Add.
= 30
Divide.
48 - 30 = 18
Distance from the mean to the upper edge.
3\sigma = 18
The 99.7% edges are 3σ from the mean.
\sigma = 6
Divide both sides by 3.
Answer: μ = 30 and σ = 6
10.
50\% + 34\% = 84\%
Half of the values are below the mean, plus 34% up to 1σ.
69 + 3 = 72
So the 84th percentile is 1σ above the mean.
Answer: about 72 inches
Empirical rule FAQ
What is the empirical rule in statistics?
It says that for a normal distribution, about 68% of values are within 1 standard deviation of the mean, 95% are within 2, and 99.7% are within 3.
What percent of data is within 2 standard deviations of the mean?
For data that are close to normal, about 95%. The other 5% is split evenly, with about 2.5% in each tail.
When can you use the empirical rule?
Use it when the distribution is close to normal: one peak, roughly symmetric and bell-shaped. Don’t use it for strongly skewed data.
What is the difference between the empirical rule and Chebyshev’s theorem?
Chebyshev’s theorem works for any distribution but gives weaker results. It says at least 75% of values are within 2 standard deviations and at least 89% are within 3. The empirical rule gives larger shares but only for normal data.
Summary
- About 68%, 95% and 99.7% of a normal distribution are within 1, 2 and 3 standard deviations of the mean.
- The pieces on each side are 34%, 13.5%, 2.35% and 0.15%.
- To use the rule, find how many σ a value is from the mean, then add the pieces.
- Split the outside percent in half to get one tail.
- Use the rule only for data that are close to normal.
Previous lesson: Normal Distribution
Next lesson: Standard Normal Distribution
Back to the Statistics Index