
Type I and Type II Errors
Type I and Type II errors are the two ways a hypothesis test can be wrong. A Type I error rejects a true null hypothesis H₀. A Type II error fails to reject a false H₀. The chance of a Type I error is α. Power, 1 − β, is the chance a test catches a false H₀.
Before this lesson: Hypothesis Testing, P-Values and One-Proportion z-Test
Two ways a test can be wrong
A test makes a decision from a sample, so it can be fooled by chance. Think of a jury trial. H₀ says the person is innocent. Convicting an innocent person is a Type I error. Letting a guilty person walk away is a Type II error.
Each decision can be right or wrong, depending on the truth, which you never see. The table shows all four cases.
| Decision | H₀ is true | H₀ is false |
|---|---|---|
| Reject H₀ | Type I error (false alarm) | Correct decision (power) |
| Fail to reject H₀ | Correct decision | Type II error (missed effect) |
A Type I error is like a false positive: the test says “something is going on” when nothing is. A Type II error is like a false negative: something is going on, but the test misses it.
Type I error, Type II error and power
- P(Type I error) = α. If H₀ is true, the test rejects it with probability α, the significance level.
- P(Type II error) = β. If H₀ is false, β is the chance the test fails to reject it. β depends on the true value of the parameter.
- Power = 1 − β. Power is the chance the test correctly rejects a false H₀.
- You only reject when the p-value ≤ α. So after rejecting, only a Type I error is possible. After failing to reject, only a Type II error is possible.
What changes power
- A larger sample size n raises power, because the standard error shrinks.
- A larger α raises power, but it also raises the Type I error risk.
- A true value farther from the null value is easier to detect, so power is higher.
- Less variability in the data raises power.
Type I and Type II error examples
Example 1: Errors in context (word problem)
A juice machine should fill bottles with 500 mL on average. Each hour, a worker tests H₀: μ = 500 against Hₐ: μ ≠ 500. If the test rejects H₀, the line stops so the machine can be fixed. Describe each error and its cost.
- Type I error: the machine is filling correctly (μ = 500), but the test finds convincing evidence that it isn’t. The line stops for no reason, which wastes time and money.
- Type II error: the machine is off (μ ≠ 500), but the test doesn’t find convincing evidence. Bottles keep getting the wrong amount, so customers get underfilled bottles or the company gives away extra juice.
Answer: a Type I error is a needless shutdown. A Type II error is a missed problem that keeps going. Always describe errors in the words of the problem, not just “reject a true H₀.”
Example 2: Which error is possible?
A test of H₀: p = 0.30 gives a p-value of 0.03, with α = 0.05. Which type of error could the test have made?
0.03 \lt 0.05
Compare the p-value with α.
The p-value is less than α, so the test rejects H₀. Rejecting can only be wrong if H₀ is true. Answer: only a Type I error is possible. You can’t know whether an error actually happened, because the true p is unknown.
Example 3: The chance of at least one Type I error
A science club runs 20 separate tests, each at α = 0.05. Suppose H₀ is true in every test and the tests are independent. Find the expected number of Type I errors and the chance of at least one.
20 \cdot 0.05 = 1
Multiply the number of tests by α.
1 - 0.05 = 0.95
Find the chance one test makes no error (see the complement rule).
0.95^{20} \approx 0.3585Multiply for 20 independent tests (see independent events).
1 - 0.3585 = 0.6415
Subtract from 1 to get “at least one.”
Answer: the club should expect about 1 false alarm, and the chance of at least one is about 0.64. This is why a single “significant” result among many tests needs to be checked again with new data.
Example 4: Finding power
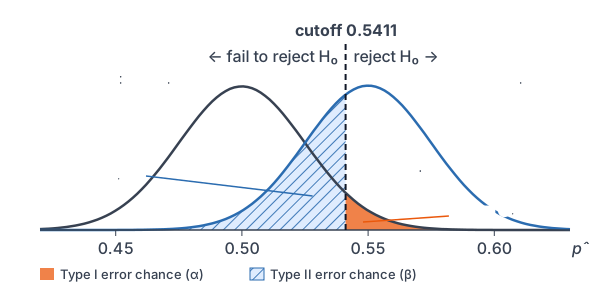
A coach tests H₀: p = 0.50 against Hₐ: p > 0.50 for a player’s free-throw rate, using n = 400 shots and α = 0.05. Suppose the true rate is really p = 0.55. Find the power of the test and β.
First find the cutoff: the smallest p̂ that leads to rejecting H₀.
0.5 \cdot 0.5 = 0.25
Multiply p₀(1 − p₀).
\dfrac{0.25}{400} = 0.000625Divide by n.
\text{SE}_0 = \sqrt{0.000625} = 0.025Take the square root (see square roots).
z^* = \text{invNorm}(0.95) \approx 1.645Find the z that cuts off the top 5%.
1.645 \cdot 0.025 \approx 0.0411
Multiply z* by the standard error.
0.50 + 0.0411 = 0.5411
Add to p₀ to get the cutoff.
The test rejects H₀ when p̂ ≥ 0.5411. Now find the chance of that when p really is 0.55.
0.55 \cdot 0.45 = 0.2475
Multiply p(1 − p) using the true p.
\dfrac{0.2475}{400} = 0.00061875Divide by n.
\text{SE}_1 = \sqrt{0.00061875} \approx 0.02487Take the square root.
z = \dfrac{0.5411 - 0.55}{0.02487} = \dfrac{-0.0089}{0.02487}Subtract the true p from the cutoff.
\approx -0.358
Divide by the standard error.
\text{Power} = \text{normalcdf}(-0.358, 10^{99})Find the area to the right (see normal probability calculations).
\approx 0.6398
Read the calculator result.
\beta = 1 - 0.6398 = 0.3602
Subtract the power from 1.
Answer: the power is about 0.64 and β ≈ 0.36. If the player really makes 55% of free throws, this test will miss it about 36% of the time.
Example 5: A bigger sample raises power
Repeat Example 4 with n = 900 shots instead of 400. Everything else stays the same.
\dfrac{0.25}{900} \approx 0.0002778Divide p₀(1 − p₀) = 0.25 by n.
\text{SE}_0 = \sqrt{0.0002778} \approx 0.01667Take the square root.
1.645 \cdot 0.01667 \approx 0.0274
Multiply z* by the standard error.
0.50 + 0.0274 = 0.5274
Add to p₀ to get the cutoff.
\dfrac{0.2475}{900} = 0.000275Divide p(1 − p) = 0.2475 by n.
\text{SE}_1 = \sqrt{0.000275} \approx 0.01658Take the square root.
z = \dfrac{0.5274 - 0.55}{0.01658} = \dfrac{-0.0226}{0.01658}Subtract the true p from the cutoff.
\approx -1.363
Divide by the standard error.
\text{Power} = \text{normalcdf}(-1.363, 10^{99})Find the area to the right.
\approx 0.9136
Read the calculator result.
\beta = 1 - 0.9136 = 0.0864
Subtract the power from 1.
Answer: the power rises from about 0.64 to about 0.91, and β drops from 0.36 to about 0.09. The larger sample makes both curves narrower, so they overlap less. α is still 0.05.
Common mistakes
| Mistake | Example of the error | Fix |
|---|---|---|
| Mixing up the two errors | Calling a false alarm a Type II error | Type I = reject a true H₀ (false alarm). Type II = fail to reject a false H₀ (miss). |
| Thinking α is the chance H₀ is true | “There is a 5% chance H₀ is true.” | α is the chance of rejecting H₀ if H₀ is true. |
| Saying an error definitely happened | “We rejected H₀, so we made a Type I error.” | You can only say which error is possible. |
| Thinking power is 1 − α | “α = 0.05, so power = 0.95.” | Power = 1 − β. It depends on n, α and the true value. |
| Always choosing a tiny α | Using α = 0.001 to be “safe” | A smaller α lowers the Type I risk but raises β and lowers power. |
Related methods
Choosing α from the costs
Pick α by asking which error is worse. If a false alarm is very costly, use a small α such as 0.01. If missing a real effect is worse, a larger α such as 0.10 gives more power.
Planning the sample size
Researchers often choose n before collecting data so the test has power of at least 0.80 for the smallest effect they care about. This is like choosing n for a target margin of error in a confidence interval.
Practice problems
- A drug company tests H₀: a new drug works no better than the old one. Describe a Type I error in context.
- Use Problem 1. Describe a Type II error in context.
- A test uses α = 0.10. If H₀ is true, what is the chance of a Type I error?
- A test has power 0.85 against a certain alternative. Find β.
- A test gives a p-value of 0.12 with α = 0.05. Which type of error could have happened?
- A lab runs 10 independent tests at α = 0.05, and H₀ is true in all of them. Find the chance of at least one Type I error.
- Does each change raise or lower power? (a) n goes from 100 to 400. (b) α goes from 0.05 to 0.01.
- A smoke detector tests H₀: there is no fire. Which error is a false alarm? Which error is more serious?
- A test of H₀: p = 0.40 against Hₐ: p > 0.40 uses n = 600 and α = 0.05. Find the power if the true p is 0.45.
- Use Problem 9. Find β, and name two ways to raise the power.
Show answers
1.
Answer: The test concludes the new drug works better when it really doesn’t. Patients may switch to a drug that is no better.
2.
Answer: The new drug really works better, but the test doesn’t find convincing evidence. A better drug may not be used.
3.
Answer: 0.10, because P(Type I error) = α.
4.
\beta = 1 - 0.85 = 0.15
Subtract the power from 1.
Answer: β = 0.15
5.
0.12 \gt 0.05
Compare the p-value with α.
Answer: The test fails to reject H₀, so only a Type II error is possible.
6.
1 - 0.05 = 0.95
Chance one test makes no error.
0.95^{10} \approx 0.5987Multiply for 10 independent tests.
1 - 0.5987 = 0.4013
Subtract from 1.
Answer: about 0.40
7.
Answer: (a) Raises power, because a larger n shrinks the standard error. (b) Lowers power, because a smaller α moves the cutoff farther out.
8.
Answer: A false alarm is a Type I error (the alarm sounds with no fire). A Type II error (no alarm during a real fire) is more serious, so detectors are set to be very sensitive.
9.
0.4 \cdot 0.6 = 0.24
Multiply p₀(1 − p₀).
\dfrac{0.24}{600} = 0.0004Divide by n.
\text{SE}_0 = \sqrt{0.0004} = 0.02Take the square root.
1.645 \cdot 0.02 = 0.0329
Multiply z* by the standard error.
0.40 + 0.0329 = 0.4329
Add to p₀ to get the cutoff.
0.45 \cdot 0.55 = 0.2475
Multiply p(1 − p) using the true p.
\dfrac{0.2475}{600} = 0.0004125Divide by n.
\text{SE}_1 = \sqrt{0.0004125} \approx 0.02031Take the square root.
z = \dfrac{0.4329 - 0.45}{0.02031} = \dfrac{-0.0171}{0.02031}Subtract the true p from the cutoff.
\approx -0.842
Divide by the standard error.
\text{Power} = \text{normalcdf}(-0.842, 10^{99}) \approx 0.8001Find the area to the right.
Answer: power ≈ 0.80
10.
\beta = 1 - 0.8001 = 0.1999
Subtract the power from 1.
Answer: β ≈ 0.20. To raise power, use a larger sample or a larger α (power is also higher when the true p is farther from 0.40).
Type I and Type II errors FAQ
What is the difference between a Type I and a Type II error?
A Type I error rejects a true null hypothesis, like a false alarm. A Type II error fails to reject a false null hypothesis, like missing a real effect.
What is the probability of a Type I error?
It equals the significance level α. If you test at α = 0.05 and H₀ is true, the test wrongly rejects H₀ 5% of the time.
What is the power of a test?
Power is the chance that a test rejects H₀ when H₀ is false. It equals 1 − β, where β is the chance of a Type II error.
How do you increase the power of a test?
Use a larger sample, a larger α, or data with less variability. Power is also higher when the true value is farther from the null value.
Summary
- A Type I error rejects a true H₀ (a false alarm). Its probability is α.
- A Type II error fails to reject a false H₀ (a miss). Its probability is β.
- Power = 1 − β, the chance of correctly rejecting a false H₀.
- After rejecting, only a Type I error is possible; after failing to reject, only a Type II error is possible.
- Larger n, larger α and a bigger true effect all raise power.
Previous lesson: One-Proportion z-Test
Next lesson: Two-Proportion z-Test
Back to the Statistics Index