
Graphing Logarithmic Functions
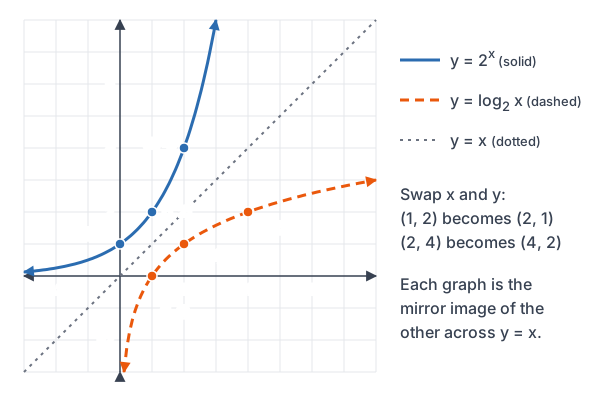
Graphing logarithmic functions starts with the parent graph y = \log_b x. It passes through (1, 0) and (b, 1), gets close to the vertical asymptote x = 0 without touching it, and is the mirror image of y = b^x across the line y = x. To graph any log function, shift and stretch this parent graph.
Before this lesson: You should know Logarithms, Exponential Functions, Inverse Functions and Transformations of Functions.
Why a Log Graph Looks the Way It Does
A logarithm undoes an exponent, so y = \log_2 x is the inverse of y = 2^x. To graph an inverse, swap the x- and y-values of each point.
| y = 2^x | y = \log_2 x |
|---|---|
| (-2, \frac{1}{4}) | (\frac{1}{4}, -2) |
| (-1, \frac{1}{2}) | (\frac{1}{2}, -1) |
| (0, 1) | (1, 0) |
| (1, 2) | (2, 1) |
| (2, 4) | (4, 2) |
| (3, 8) | (8, 3) |
The exponential graph hugs the x-axis on the left. So the log graph hugs the y-axis near the bottom. The exponential graph shoots up fast, so the log graph rises more and more slowly.
Key Features of the Parent Graph
Here are the key features of the parent function y = \log_b x with base b \gt 1, including its domain and range:
| Feature | Value |
|---|---|
| Domain | x \gt 0 (you can only take the log of a positive number) |
| Range | All real numbers |
| x-intercept | (1, 0), because \log_b 1 = 0 |
| Another key point | (b, 1), because \log_b b = 1 |
| Vertical asymptote | x = 0 (the y-axis) |
| Direction | Rises from left to right, but more and more slowly |
A vertical asymptote is a vertical line the graph gets closer and closer to but never touches. You saw these in graphing rational functions. The log graph has no y-intercept, because x = 0 is not in the domain. For a base between 0 and 1, the graph falls from left to right instead.
The Transformed Log Function
y = a \log_b (x - h) + k
| Part | What it does |
|---|---|
| h | Shifts the graph right h (left if h is negative). The asymptote moves to x = h. |
| k | Shifts the graph up k (down if k is negative). |
| a | Stretches the graph by a factor of a. A negative a flips it over the x-axis. |
Steps to graph a log function:
- Find the vertical asymptote. Set the inside of the log equal to 0 and solve. For \log_b (x - h), the asymptote is x = h.
- Start with three parent points: (\frac{1}{b}, -1), (1, 0) and (b, 1).
- Move each point. Add h to the x-value. Multiply the y-value by a, then add k.
- Plot the new points and draw a smooth curve. Make it bend toward the asymptote without touching it.
- State the domain (x \gt h) and the range (all real numbers).
Worked Examples
Example 1: Graph a parent log function
Graph y = \log_3 x. State the domain, range and asymptote.
Choose x-values that are powers of 3: \frac{1}{3}, 1, 3 and 9.
3^{-1} = \frac{1}{3}Find y at x = \frac{1}{3}.
\log_3 \frac{1}{3} = -1Write it as a log.
3^0 = 1
Find y at x = 1.
\log_3 1 = 0
Write it as a log.
3^1 = 3
Find y at x = 3.
\log_3 3 = 1
Write it as a log.
3^2 = 9
Find y at x = 9.
\log_3 9 = 2
Write it as a log.
Plot (\frac{1}{3}, -1), (1, 0), (3, 1) and (9, 2). Draw a curve that drops toward the y-axis on the left.
Answer: Domain x \gt 0, range all real numbers, vertical asymptote x = 0. The graph rises slowly to the right.
Example 2: Shift right and up
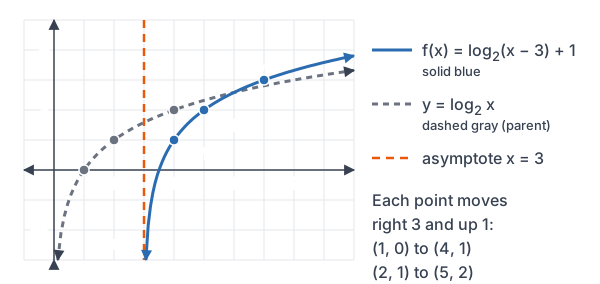
Graph f(x) = \log_2 (x - 3) + 1.
x - 3 = 0
Set the inside equal to 0.
x = 3
Add 3 to both sides. This is the vertical asymptote.
Read the shifts: h = 3 (right 3) and k = 1 (up 1).
(\frac{1}{2} + 3, -1 + 1) = (3\frac{1}{2}, 0)Move (\frac{1}{2}, -1).
(1 + 3, 0 + 1) = (4, 1)
Move (1, 0).
(2 + 3, 1 + 1) = (5, 2)
Move (2, 1).
(4 + 3, 2 + 1) = (7, 3)
Move (4, 2).
Check (7, 3). Use \log_2 4 = 2, then add 1: f(7) = \log_2 4 + 1 = 2 + 1 = 3
Plot the points and draw the curve to the right of x = 3.
Answer: Asymptote x = 3, domain x \gt 3, range all real numbers. The x-intercept is (3\frac{1}{2}, 0).
Example 3: Shift left and reflect
Graph g(x) = -\log_2 (x + 4).
x + 4 = 0
Set the inside equal to 0.
x = -4
Subtract 4 from both sides. This is the vertical asymptote.
Read the parts: h = -4 (left 4) and a = -1 (flip over the x-axis).
(\frac{1}{2} - 4, -1 \cdot (-1)) = (-3\frac{1}{2}, 1)Move (\frac{1}{2}, -1).
(1 - 4, -1 \cdot 0) = (-3, 0)
Move (1, 0).
(2 - 4, -1 \cdot 1) = (-2, -1)
Move (2, 1).
(4 - 4, -1 \cdot 2) = (0, -2)
Move (4, 2).
Plot the points. The curve falls from left to right.
Answer: Asymptote x = -4, domain x \gt -4, range all real numbers. The graph falls from left to right and crosses the y-axis at (0, -2).
Example 4: Find the domain, asymptote and x-intercept
For h(x) = \log (2x - 6), find the domain, the vertical asymptote and the x-intercept.
2x - 6 \gt 0
The inside must be positive.
2x \gt 6
Add 6 to both sides.
x \gt 3
Divide both sides by 2 (see multi-step inequalities)
x = 3
The asymptote is where the inside equals 0.
\log (2x - 6) = 0
For the x-intercept, set h(x) = 0.
2x - 6 = 10^0
Rewrite in exponential form (see logarithms)
2x - 6 = 1
Simplify the power.
2x = 7
Add 6 to both sides.
x = 3\frac{1}{2}Divide both sides by 2.
Answer: Domain x \gt 3, vertical asymptote x = 3, x-intercept (3\frac{1}{2}, 0).
Example 5: Word problem with a growth model
A seedling’s height in inches t weeks after it sprouts is modeled by H(t) = 5 \log_2 (t + 1) + 2. Find its height at 0, 1, 3 and 7 weeks. Then find when it reaches 22 inches.
5 \log_2 1 + 2 = 5 \cdot 0 + 2 = 2
Find H(0) using \log_2 1 = 0.
5 \log_2 2 + 2 = 5 \cdot 1 + 2 = 7
Find H(1) using \log_2 2 = 1.
5 \log_2 4 + 2 = 5 \cdot 2 + 2 = 12
Find H(3) using \log_2 4 = 2.
5 \log_2 8 + 2 = 5 \cdot 3 + 2 = 17
Find H(7) using \log_2 8 = 3.
5 \log_2 (t + 1) + 2 = 22
Set the height to 22.
5 \log_2 (t + 1) = 20
Subtract 2 from both sides.
\log_2 (t + 1) = 4
Divide both sides by 5.
t + 1 = 2^4
Rewrite in exponential form.
t + 1 = 16
Simplify the power.
t = 15
Subtract 1 from both sides.
Answer: The heights are 2, 7, 12 and 17 inches. It reaches 22 inches at 15 weeks. The graph rises fast at first, then slows down. Each time t + 1 doubles, the height grows only 5 more inches.
Common Mistakes
| Mistake | Example of the error | Fix |
|---|---|---|
| Using the wrong sign for the asymptote | y = \log (x - 3) has asymptote x = -3 | Set x - 3 = 0. The asymptote is x = 3. |
| Shifting the wrong way | \log_2 (x + 4) moved right 4 | A plus sign inside moves the graph left: left 4. |
| Including the asymptote in the domain | Domain of \log x is x \ge 0 | The log of 0 is undefined, so the domain is x \gt 0. |
| Mixing up log and exponential key points | y = \log_2 x passes through (0, 1) | That point is on y = 2^x. The log graph passes through (1, 0). |
| Letting the curve touch the asymptote | Drawing the graph crossing x = 0 | The curve gets close to the asymptote but never reaches it. |
Related Methods
Graph from the exponential function
If you can graph y = b^x, you can graph y = \log_b x. Swap the coordinates of each point and reflect the graph across y = x. The horizontal asymptote y = 0 of the exponential graph becomes the vertical asymptote x = 0 of the log graph.
The natural log graph
The graph of y = \ln x has base the number e, which is about 2.718. It passes through (1, 0) and (e, 1) \approx (2.72, 1), with asymptote x = 0. It sits between the graphs of \log_2 x and \log_3 x.
Bases between 0 and 1
When 0 \lt b \lt 1, the graph falls from left to right. For example, y = \log_{\frac{1}{2}} x passes through (\frac{1}{2}, 1), (1, 0) and (2, -1). It is the same as y = -\log_2 x.
Practice Problems
- List four points on y = \log_4 x using x-values \frac{1}{4}, 1, 4 and 16.
- Find the vertical asymptote and domain of y = \log_5 (x - 2).
- Find the vertical asymptote, domain and range of y = \ln (x + 6) - 1.
- Graph y = \log_2 x + 3 by moving the points (\frac{1}{2}, -1), (1, 0), (2, 1) and (4, 2).
- Graph y = \log_3 (x - 1) by moving the points (\frac{1}{3}, -1), (1, 0), (3, 1) and (9, 2).
- Graph y = -\log_3 x. Does it rise or fall from left to right?
- Graph y = 2 \log_2 (x + 1). Give the asymptote and the y-intercept.
- Find the domain of y = \log (3x + 12).
- Find the x-intercept of y = \log_2 (x - 5).
- A store models its daily visitors after spending d hundred dollars on ads as V(d) = 200 \log_2 (d + 2). Find V(0) and V(6). Then find how much it must spend to get 800 visitors.
Show answers
1.
4^{-1} = \frac{1}{4}, so \log_4 \frac{1}{4} = -1
4^0 = 1, so \log_4 1 = 0
4^1 = 4, so \log_4 4 = 1
4^2 = 16, so \log_4 16 = 2
Answer: (\frac{1}{4}, -1), (1, 0), (4, 1), (16, 2)
2.
x - 2 = 0
Set the inside equal to 0.
x = 2
Add 2 to both sides.
Answer: asymptote x = 2, domain x \gt 2
3.
x + 6 = 0
Set the inside equal to 0.
x = -6
Subtract 6 from both sides.
The shift down 1 does not change the range.
Answer: asymptote x = -6, domain x \gt -6, range all real numbers
4.
Shift up 3, so add 3 to each y-value
(\frac{1}{2}, -1 + 3) = (\frac{1}{2}, 2)Shift up 3: add 3 to the y-value.
(1, 0 + 3) = (1, 3)
Shift up 3: add 3 to the y-value.
(2, 1 + 3) = (2, 4)
Shift up 3: add 3 to the y-value.
(4, 2 + 3) = (4, 5)
Shift up 3: add 3 to the y-value.
Answer: plot these points; the asymptote stays x = 0
5.
Shift right 1, so add 1 to each x-value
(\frac{1}{3} + 1, -1) = (1\frac{1}{3}, -1)Shift right 1: add 1 to the x-value.
(1 + 1, 0) = (2, 0)
Shift right 1: add 1 to the x-value.
(3 + 1, 1) = (4, 1)
Shift right 1: add 1 to the x-value.
(9 + 1, 2) = (10, 2)
Shift right 1: add 1 to the x-value.
Answer: plot these points; the asymptote is x = 1
6.
Multiply each y-value of y = \log_3 x by −1
(\frac{1}{3}, -1) becomes (\frac{1}{3}, 1)
(1, 0) stays (1, 0)
(3, 1) becomes (3, -1)
(9, 2) becomes (9, -2)
Answer: it falls from left to right
7.
x + 1 = 0
Find the asymptote: set the inside equal to 0.
x = -1
Subtract 1 from both sides.
(\frac{1}{2} - 1, 2 \cdot (-1)) = (-\frac{1}{2}, -2)Move (\frac{1}{2}, -1).
(1 - 1, 2 \cdot 0) = (0, 0)
Move (1, 0).
(2 - 1, 2 \cdot 1) = (1, 2)
Move (2, 1).
(4 - 1, 2 \cdot 2) = (3, 4)
Move (4, 2).
Answer: asymptote x = -1, y-intercept (0, 0)
8.
3x + 12 \gt 0
The inside must be positive.
3x \gt -12
Subtract 12 from both sides.
x \gt -4
Divide both sides by 3.
Answer: x \gt -4
9.
\log_2 (x - 5) = 0
Set y = 0.
x - 5 = 2^0
Rewrite in exponential form.
x - 5 = 1
Simplify the power.
x = 6
Add 5 to both sides.
Answer: (6, 0)
10.
V(0) = 200 \log_2 2 = 200 \cdot 1 = 200
Find V(0) using \log_2 2 = 1.
V(6) = 200 \log_2 8 = 200 \cdot 3 = 600
Find V(6) using \log_2 8 = 3.
200 \log_2 (d + 2) = 800
Set V(d) = 800.
\log_2 (d + 2) = 4
Divide both sides by 200.
d + 2 = 2^4
Rewrite in exponential form.
d + 2 = 16
Simplify the power.
d = 14
Subtract 2 from both sides.
Answer: 200 and 600 visitors; it must spend 14 hundred dollars, or $1,400
FAQ
What does the graph of a logarithmic function look like?
The parent graph y = \log_b x with b \gt 1 starts low next to the y-axis, crosses the x-axis at (1, 0) and rises more and more slowly to the right. It never touches the y-axis.
How do you find the vertical asymptote of a log function?
Set the inside of the log equal to 0 and solve for x. For y = \log (x - 7), the asymptote is x = 7.
What is the domain of a logarithmic function?
The inside of the log must be positive. For y = \log_b (x - h), the domain is x \gt h. The range is always all real numbers.
How are log graphs and exponential graphs related?
They are inverses, so each one is the reflection of the other across the line y = x. The point (0, 1) on y = b^x matches the point (1, 0) on y = \log_b x.
Summary
- y = \log_b x passes through (\frac{1}{b}, -1), (1, 0) and (b, 1), with vertical asymptote x = 0.
- The log graph is the reflection of y = b^x across y = x.
- For y = a \log_b (x - h) + k, the asymptote is x = h and the domain is x \gt h.
- Shift each point right h, multiply its y-value by a, then shift it up k.
- The range of every log function is all real numbers.
Previous lesson: Logarithms
Next lesson: Properties of Logarithms
Back to the Algebra 2 Index