
Probability Simulations
A probability simulation estimates a probability by imitating a random event many times with random numbers. You assign numbers to each outcome, run many trials with a random digit table, a calculator or a computer, and count how often the event happens. The fraction of trials where it happens is your estimate.
Before this lesson: Probability, Percentages and Sampling Methods
What a simulation does
Some probabilities are hard to find with a formula. A simulation lets you skip the formula. You build a model of the random process and let chance play it out again and again.
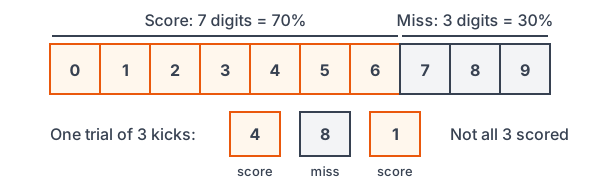
For example, a soccer player scores on 70% of her penalty kicks. What is the chance she scores on all 3 of her next kicks? You could use random digits: 0 to 6 mean “score” and 7 to 9 mean “miss.” Read 3 digits for each set of 3 kicks and count how often all 3 are scores.
The estimate from a simulation is called a simulated or experimental probability. With more trials, it tends to get closer to the true probability.
How to run a probability simulation
- State the question you want to answer.
- Plan: describe how you will use random numbers to model one outcome and one trial, including what you will record.
- Do: carry out many trials and record the results.
- Conclude: use the share of successful trials to estimate the probability, and answer the question.
When you plan, the digits you assign must match the probabilities. Each digit 0 to 9 is equally likely, so each digit stands for 10%. For a probability like 37%, use pairs of digits: 00 to 99 give 100 equally likely values, and 00 to 36 stand for the 37%.
Probability simulation examples
Example 1: Assign digits to outcomes
A cereal company puts a prize in 30% of its boxes. Show how to use single random digits to model one box.
30\% = \dfrac{3}{10}Write the percent as a fraction with denominator 10.
\text{digits 0, 1, 2: prize}Assign 3 of the 10 digits to a prize.
\text{digits 3 to 9: no prize}The other 7 digits stand for no prize.
\dfrac{7}{10} = 70\%Check: the no-prize digits give the other 70%.
Answer: let 0, 1 and 2 stand for a box with a prize, and 3 through 9 for a box with no prize. Any 3 digits would work, as long as there are exactly 3 of them.
Example 2: Simulate with a random digit table
The soccer player above scores 70% of the time. Use 0 to 6 for a score and 7 to 9 for a miss. Each group of 3 digits is one trial of 3 kicks. Estimate the probability that she scores on all 3 kicks, using these 10 trials:
481 207 935 162 704 558 316 029 873 641
\text{481: 8 is a miss}Check each trial for a digit 7, 8 or 9.
\text{207, 935, 704, 558, 029, 873: each has a miss}These trials are not successes.
\text{162, 316, 641: all digits 0 to 6}These 3 trials are successes.
\dfrac{3}{10} = 0.3Divide the successes by the number of trials.
Answer: the simulation estimates the probability as 0.3. The true probability is about 0.34, so 10 trials gave a rough but reasonable estimate. More trials would usually give a closer one.
Example 3: Simulate a waiting time
A game gives a winning card with 20% of purchases. Estimate the mean number of cards someone buys to get the first win. Let 0 and 1 be a win and 2 to 9 a loss. Read digits until a win, then start a new trial. Use these digits:
73914 08652 31029 740
7, 3, 9, 1 \rightarrow 4 \text{ cards}Trial 1 ends at the first 0 or 1.
4, 0 \rightarrow 2 \text{ cards}Trial 2.
8, 6, 5, 2, 3, 1 \rightarrow 6 \text{ cards}Trial 3.
0 \rightarrow 1 \text{ card}Trial 4 wins on the first card.
2, 9, 7, 4, 0 \rightarrow 5 \text{ cards}Trial 5.
4 + 2 + 6 + 1 + 5 = 18
Add the numbers of cards.
\dfrac{18}{5} = 3.6Divide by 5 trials to find the mean (see mean).
Answer: these 5 trials suggest about 3.6 cards on average. In the long run the true mean is 5 cards, which shows how much 5 trials can vary. A real simulation would use many more trials.
Example 4: Simulate with a calculator
Estimate the probability of rolling at least one 6 in 4 rolls of a fair die. On a TI-84, randInt(1,6,4) rolls 4 dice at once (MATH, PRB, 5:randInt). A class ran 100 trials and got at least one 6 in 52 of them. Find the simulated probability and compare it with the true probability.
\dfrac{52}{100} = 0.52Divide the successes by the number of trials.
\left(\dfrac{5}{6}\right)^4 = \dfrac{625}{1296}Find the chance of no 6 in 4 rolls (see exponents).
1 - \dfrac{625}{1296} = \dfrac{671}{1296}Subtract from 1 to get at least one 6.
\dfrac{671}{1296} \approx 0.518Divide.
Answer: the simulated probability is 0.52, very close to the true value of about 0.518. In Desmos, randint(1, 6, 4) does the same job. The next lesson explains the “subtract from 1” step, called the complement rule.
Example 5: Is the result surprising? (word problem)
A student guesses on a 5-question true-false quiz and gets at least 4 right. Her teacher wonders if that is surprising. The class simulates 50 quizzes by flipping a coin 5 times for each one (heads = correct):
| Number correct | 0 | 1 | 2 | 3 | 4 | 5 |
|---|---|---|---|---|---|---|
| Number of trials | 2 | 8 | 15 | 16 | 7 | 2 |
Estimate the probability of getting at least 4 right by guessing.
2 + 8 + 15 + 16 + 7 + 2 = 50
Check that the trials add to 50.
7 + 2 = 9
Add the trials with 4 or 5 correct.
\dfrac{9}{50} = 0.18Divide by the number of trials.
0.18 = 18\%
Write it as a percent (see percentages).
Answer: about 0.18. A guesser gets at least 4 right in roughly 1 out of 6 quizzes, so this result alone is not strong evidence that the student knew the answers. (The true probability is 6 out of 32, or about 0.19.)
Common mistakes
| Mistake | Example of the error | Fix |
|---|---|---|
| Digits don’t match the probability | Using 0 to 6 for a 60% event | Count the digits: 0 to 5 is six digits, which is 60%. |
| Using single digits for a two-digit percent | Trying to model 37% with single digits | Use pairs 00 to 99, and assign 00 to 36. |
| Reusing a number when you shouldn’t | Choosing the same person twice when picking 3 different people | Skip repeats when the setting doesn’t allow them. |
| Too few trials | Trusting an estimate from 5 trials | Run many trials; estimates get steadier as trials increase. |
| Counting digits instead of trials | Dividing successes by 30 digits instead of 10 trials | Divide by the number of trials. |
| Treating the estimate as exact | “The probability is exactly 0.3.” | Say the simulation estimates it as about 0.3. |
Related methods
Simulation vs. theoretical probability
A theoretical probability comes from counting equally likely outcomes, as in basic probability. A simulation estimates it when counting is hard. When you can do both, as in Example 4, the two should be close.
Random numbers in sampling and experiments
The same random digits are used to choose a simple random sample in sampling methods and to assign treatments in experimental design. In each case, chance makes the process fair.
Practice problems
- A spinner lands on red 40% of the time. Assign single digits to model one spin.
- A shopper uses a coupon 37% of the time. Assign two-digit numbers to model one shopper.
- Use the digits 5 8 2 7 1 4 6 9 0 3 to simulate 10 coin tosses, with even digits as heads. How many heads are there, and what share of tosses is that?
- A simulation has 200 trials, and the event happens in 40 of them. Estimate the probability.
- Why does a simulation with 1,000 trials usually beat one with 10 trials?
- Which TI-84 command simulates rolling 2 dice at once?
- A batter gets a hit 30% of the time. Let 0 to 2 be a hit. Each pair of digits is one game with 2 at-bats. Estimate the probability of at least one hit using: 08 53 21 97 46 12 70 85 33 29.
- In 60 simulated trials, the numbers of rolls needed to get the first 6 add up to 372. Estimate the mean number of rolls.
- A result as extreme as the one observed happened in 3 of 50 simulated trials. Estimate its probability. Is it below 5%?
- A student uses digits 0 to 6 to model an event with probability 60%. What is wrong, and how do you fix it?
Show answers
1.
40\% = \dfrac{4}{10}Write the percent with denominator 10.
\text{digits 0 to 3: red}Assign 4 digits to red.
Answer: 0, 1, 2 and 3 are red; 4 to 9 are not red
2.
37\% = \dfrac{37}{100}Use 100 equally likely pairs of digits.
\text{00 to 36: coupon}That is 37 pairs.
Answer: 00 to 36 uses a coupon; 37 to 99 doesn’t
3.
\text{evens: 8, 2, 4, 6, 0}Find the even digits.
\dfrac{5}{10} = 0.5Divide heads by tosses.
Answer: 5 heads, which is 0.5 of the tosses
4.
\dfrac{40}{200} = 0.2Divide successes by trials.
Answer: about 0.2
5.
\text{more trials}Chance differences average out over many trials.
Answer: with more trials, the simulated probability tends to be closer to the true probability
6.
\text{randInt(1,6,2)}The third number says how many values to produce.
Answer: randInt(1,6,2)
7.
\text{08, 21, 12, 70, 29: at least one 0, 1 or 2}Mark trials with a hit.
\text{53, 97, 46, 85, 33: no hit}These trials are not successes.
\dfrac{5}{10} = 0.5Divide successes by trials.
Answer: about 0.5 (the true value is 0.51)
8.
\dfrac{372}{60} = 6.2Divide the total by the number of trials.
Answer: about 6.2 rolls
9.
\dfrac{3}{50} = 0.06Divide successes by trials.
0.06 = 6\%
Write as a percent.
Answer: about 0.06, which is not below 5%
10.
\dfrac{7}{10} = 70\%Digits 0 to 6 are 7 digits, which is 70%.
\dfrac{6}{10} = 60\%Six digits give 60%.
Answer: 0 to 6 models 70%, not 60%; use 0 to 5 instead
Probability simulation FAQ
What is a simulation in probability?
It is a model of a random process that uses random numbers to imitate it many times. The share of trials where an event happens estimates its probability.
How do you use a random digit table for a simulation?
Assign digits to outcomes so the share of digits matches each probability. Then read digits in order, one trial at a time, and record whether each trial is a success.
How many trials should a simulation have?
As many as you can. Class simulations often use 50 to 100 trials, and a computer can run thousands. More trials usually give an estimate closer to the true probability.
What is the difference between simulated and theoretical probability?
Theoretical probability comes from counting equally likely outcomes. Simulated probability is an estimate from repeated random trials, so it changes a little each time you run it.
Summary
- A simulation estimates a probability by imitating a random event many times.
- Assign random numbers so their shares match the probabilities: each single digit is 10%, each pair from 00 to 99 is 1%.
- Follow state, plan, do, conclude.
- Simulated probability = number of successful trials divided by the number of trials.
- More trials usually give an estimate closer to the true probability.
Previous lesson: Block Designs and Matched Pairs
Next lesson: Probability Rules
Back to the Statistics Index