
Sketching the Graph of a Derivative
Sketching the graph of a derivative means drawing f’ from the graph of f by reading slopes. Where f has a horizontal tangent, f’ = 0. Where f rises, f’ is above the x-axis, and where f falls, f’ is below it. Steeper parts of f give values of f’ farther from 0.
Before this lesson: Definition of the Derivative, Key Features of Functions and Slope
Reading slopes from a graph
The derivative f'(x) is the slope of f at x. So to sketch f’, you do not need a formula. Walk along the graph of f from left to right and ask at each point: is it going up or down, and how steeply?
Three facts do most of the work. Flat spots on f, such as peaks and valleys, are zeros of f’. Rising stretches of f are where f’ is positive. Falling stretches are where f’ is negative.
The size of f’ shows the steepness. A gentle rise gives a small positive value, and a steep rise gives a large one. A straight line has the same slope everywhere, so its derivative is a horizontal line.
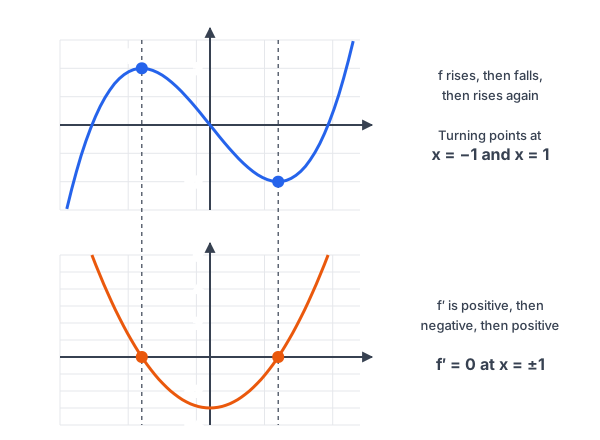
How to sketch f’ from f
| Feature of f | What it means for f’ |
|---|---|
| Horizontal tangent (peak, valley or flat spot) | f’ = 0: the graph of f’ touches or crosses the x-axis |
| Increasing | f’ is positive (above the x-axis) |
| Decreasing | f’ is negative (below the x-axis) |
| Steeper | f’ is farther from 0 |
| Straight line with slope m | f’ is the horizontal line y = m |
| Corner, cusp or break | f’ is undefined there (an open circle or gap in f’) |
- Mark every x where f has a horizontal tangent. Plot those as zeros of f’.
- Between those points, decide whether f is increasing or decreasing. Shade f’ above or below the axis.
- Estimate a few slopes to get the heights right, such as where f is steepest.
- Connect smoothly, and mark any corners or breaks of f as gaps in f’.
Sketching the graph of a derivative examples
Example 1: A straight line
Sketch the derivative of f(x) = 3x − 1.
f'(x) = 3
The graph of f is a line with slope 3 everywhere (see slope-intercept form).
Answer: f’ is the horizontal line y = 3. Every line’s derivative is a constant.
Example 2: A parabola
Sketch the derivative of f(x) = x^2 - 4x + 1 and check it with the definition.
x = 2
The vertex is at x = -\frac{b}{2a} = \frac{4}{2} = 2, a horizontal tangent, so f'(2) = 0 (see vertex form).
f'(x) \lt 0 \text{ for } x \lt 2Left of the vertex the parabola falls, so f’ is negative.
f'(x) \gt 0 \text{ for } x \gt 2Right of the vertex it rises, so f’ is positive.
f'(x) = 2x - 4
The definition gives 2x − 4: a line through (2, 0) with slope 2 (see definition of the derivative).
Answer: f’ is a rising line that crosses the x-axis at x = 2. The derivative of a parabola is a line.
Example 3: A cubic with two turning points
Sketch the derivative of f(x) = x^3 - 3x, which has a peak at (−1, 2) and a valley at (1, −2).
f'(-1) = 0
The peak at x = −1 has a horizontal tangent.
f'(1) = 0
The valley at x = 1 has a horizontal tangent.
f'(x) \gt 0 \text{ for } x \lt -1f rises on the far left.
f'(x) \lt 0 \text{ for } -1 \lt x \lt 1f falls between the turning points.
f'(x) \gt 0 \text{ for } x \gt 1f rises on the far right.
f'(0) = -3
f is steepest going down at x = 0, where its slope is −3.
Answer: f’ is an upward parabola with zeros at ±1 and its lowest point at (0, −3), as in the graph above. Its formula is f'(x) = 3x^2 - 3.
Example 4: A graph with a corner
Sketch the derivative of f(x) = |x − 1|.
f'(x) = -1 \text{ for } x \lt 1Left of 1, the graph is the line y = 1 − x, with slope −1 (see absolute value functions).
f'(x) = 1 \text{ for } x \gt 1Right of 1, the graph is the line y = x − 1, with slope 1.
f'(1) \text{ is undefined}At the corner the slope jumps from −1 to 1, so there is no single tangent line.
Answer: f’ is the horizontal ray y = −1 for x less than 1 and y = 1 for x greater than 1, with open circles at x = 1. The next lesson explains why corners have no derivative.
Example 5: Word problem with a cyclist
A cyclist rides out along a straight road and back. Her distance from home after t minutes is s(t) = 10t - t^2 hundred meters, for t from 0 to 10. Describe her velocity graph.
t = 5
The graph of s is a downward parabola with its peak at t = -\frac{10}{2(-1)} = 5. There she turns around, so the velocity is 0.
s'(t) \gt 0 \text{ for } t \lt 5Before t = 5 her distance grows: positive velocity (riding away).
s'(t) \lt 0 \text{ for } t \gt 5After t = 5 her distance shrinks: negative velocity (riding home).
s'(t) = 10 - 2t
The slopes give a falling line from 10 at t = 0 to −10 at t = 10.
Answer: her velocity graph is a falling line, starting at 10 hundred meters per minute, crossing 0 at the turnaround at t = 5 and ending at −10. The negative sign means she is heading back toward home.
Common mistakes
| Mistake | Example of the error | Fix |
|---|---|---|
| Copying the shape of f | Drawing f’ as another hill under a hill | f’ shows slopes, not heights. A hill of f becomes positive, then zero, then negative. |
| Plotting zeros of f instead of flat spots | Putting zeros of f’ where f crosses the x-axis | Zeros of f’ are where f has horizontal tangents. |
| Making f’ negative because f is below the axis | Saying f’ is negative wherever f is negative | The sign of f’ depends on rising or falling, not on the sign of f. |
| Forgetting that lines have constant derivatives | Drawing f’ for y = 3x − 1 as a slanted line | A line’s slope never changes: f’ = 3. |
| Drawing f’ through a corner | Connecting −1 and 1 with a vertical segment for |x − 1| | At a corner f’ is undefined; leave a gap with open circles. |
| Ignoring steepness | Drawing f’ with the same height everywhere f rises | Steeper parts of f give larger values of f’. |
Related methods
Going the other way
You can also read features of f from a graph of f’. Where f’ is positive, f increases; where f’ changes from positive to negative, f has a peak. This idea leads to the first derivative test in Unit 6.
Matching degrees
For polynomials, the derivative has degree one less: a line becomes a constant, a parabola becomes a line, and a cubic becomes a parabola. That is a quick check on any sketch.
Practice problems
- Describe the graph of f’ if f is the constant function f(x) = 4.
- Sketch the derivative of f(x) = −2x + 5.
- Sketch the derivative of f(x) = -x^2 + 6x.
- Sketch the derivative of f(x) = (x - 1)^2.
- Sketch the derivative of f(x) = x^3. Where is f’ equal to 0?
- A function f increases on x less than −2, decreases between −2 and 3, and increases on x greater than 3, with horizontal tangents at −2 and 3. Describe the sign of f’.
- The graph of f(x) = \sqrt{x} rises more and more slowly. Describe its derivative.
- Use the graph of y = sin x on [0, 2\pi] to describe its derivative.
- Sketch the derivative of f(x) = |x + 2|.
- Water fills a tank quickly at first, then more slowly, and then the depth stays the same. Describe the graph of the rate of change of the depth.
Show answers
1.
f'(x) = 0
A constant function is a horizontal line with slope 0.
Answer: f’ is the x-axis, y = 0.
2.
f'(x) = -2
The graph of f is a line with slope −2.
Answer: the horizontal line y = −2.
3.
x = 3
The vertex is at x = -\frac{6}{2(-1)} = 3, so f'(3) = 0.
f'(x) = -2x + 6
f rises left of 3 and falls right of 3, so f’ goes from positive to negative.
Answer: a falling line crossing the x-axis at x = 3.
4.
x = 1
The vertex is at (1, 0), so f'(1) = 0.
f'(x) = 2x - 2
f falls left of 1 and rises right of 1.
Answer: a rising line through (1, 0) with slope 2.
5.
f'(0) = 0
The graph of x^3 is flat at the origin.
f'(x) = 3x^2
Everywhere else it rises, so f’ is positive on both sides of 0.
Answer: an upward parabola touching the x-axis at x = 0. The derivative is 0 at x = 0 but never negative.
6.
f'(-2) = 0
Horizontal tangent at −2.
f'(3) = 0
Horizontal tangent at 3.
Answer: f’ is positive for x less than −2, negative between −2 and 3, and positive for x greater than 3.
7.
f'(x) = \frac{1}{2\sqrt{x}}The slope is always positive, and it shrinks as x grows (found in the previous lesson).
Answer: f’ is positive and decreasing toward 0, and it grows without bound near x = 0, where the graph of \sqrt{x} is nearly vertical.
8.
f'\left(\frac{\pi}{2}\right) = 0Sine has a peak at \frac{\pi}{2}.
f'\left(\frac{3\pi}{2}\right) = 0Sine has a valley at \frac{3\pi}{2}.
f'(0) = 1
At 0, sine rises with slope 1, its steepest.
Answer: f’ starts at 1, falls to 0 at \frac{\pi}{2}, reaches −1 at \pi, returns to 0 at \frac{3\pi}{2} and to 1 at 2\pi. It looks like the graph of cosine (see graphs of sine and cosine).
9.
f'(x) = -1 \text{ for } x \lt -2Left of the corner the slope is −1.
f'(x) = 1 \text{ for } x \gt -2Right of the corner the slope is 1.
Answer: two horizontal rays, y = −1 and y = 1, with open circles at x = −2, where f’ is undefined.
10.
\text{rate} \gt 0The depth increases at first, so the rate is positive.
\text{rate} \to 0The rise slows and then stops, so the rate shrinks to 0.
Answer: the rate starts high, decreases, and then stays at 0 once the depth stops changing.
Sketching the graph of a derivative FAQ
How do you sketch the derivative from a graph?
Mark the horizontal tangents as zeros of f’. Then make f’ positive where f rises and negative where f falls, taller where f is steeper.
Where is the derivative zero on a graph?
At every point where the tangent line is horizontal, such as the top of a hill, the bottom of a valley, or a flat spot.
What does the derivative of a parabola look like?
A straight line. It crosses the x-axis at the parabola’s vertex, rising if the parabola opens up and falling if it opens down.
Why does f’ have a gap at a corner?
At a corner the slopes on the two sides are different, so there is no single tangent line and the derivative does not exist there.
Summary
- f’ shows the slope of f: zero at horizontal tangents, positive where f rises, negative where f falls.
- Steeper parts of f give values of f’ farther from 0.
- Lines give constant derivatives; parabolas give lines; cubics give parabolas.
- At corners, cusps and breaks, f’ is undefined.
- Read slopes, not heights: the sign of f itself does not decide the sign of f’.
Previous lesson: Definition of the Derivative
Next lesson: Differentiability
Back to the Calculus 1 Index