
Curve Sketching
Curve sketching means drawing an accurate graph of a function from its formula, using f, f′ and f″ together. From f you get the domain, intercepts, symmetry and asymptotes. From f′ you get where the graph rises and falls and its local extrema. From f″ you get concavity and inflection points.
Before this lesson: First Derivative Test, Concavity and Inflection Points and Limits at Infinity
Why use calculus to sketch a graph
Plotting a few points can miss important features: a hidden peak between two points, or the exact place where a curve switches from bending up to bending down. The derivatives tell you exactly where the turning points and bends are, so the sketch has the right shape everywhere.
Curve sketching checklist
| Step | What to find | Tool |
|---|---|---|
| 1. Domain | Where f is defined | Denominators, roots, logs |
| 2. Intercepts | f(0), and solutions of f(x) = 0 | Algebra |
| 3. Symmetry | Even (f(−x) = f(x)) or odd (f(−x) = −f(x)) | Even and odd functions |
| 4. Asymptotes | Vertical and horizontal | Infinite limits and limits at infinity |
| 5. f′ | Increasing, decreasing, local max and min | Sign chart of f′ |
| 6. f″ | Concave up, concave down, inflection points | Sign chart of f″ |
| 7. Sketch | Plot key points, then connect them with the right shape | All of the above |
Not every function needs every step. A polynomial has no asymptotes, for example. A summary table that lists each interval with the signs of f′ and f″ keeps all the information in one place.
Curve sketching examples
Example 1: A cubic
Sketch f(x) = x^3 - 3x.
x^3 - 3x = x(x^2 - 3) = 0 \Rightarrow x = 0, \pm\sqrt{3}Domain: all real numbers. Intercepts: factor out x.
f(-x) = -x^3 + 3x = -f(x)
Odd: symmetric about the origin.
f'(x) = 3x^2 - 3 = 3(x - 1)(x + 1)
Critical numbers ±1. Signs of f′: +, −, +.
f(-1) = 2, \; f(1) = -2
Local max (−1, 2) and local min (1, −2).
f''(x) = 6x
Negative for x below 0, positive above 0.
f(0) = 0
Inflection point (0, 0).
Answer: the graph rises to (−1, 2), falls through the inflection point (0, 0) to (1, −2), then rises again, crossing the x-axis at about ±1.73. It is concave down on the left half and concave up on the right half.
Example 2: A quartic
Sketch f(x) = x^4 - 4x^3.
x^3(x - 4) = 0 \Rightarrow x = 0, 4
Intercepts: factor out x³.
f'(x) = 4x^3 - 12x^2 = 4x^2(x - 3)
Critical numbers 0 and 3. Signs: −, −, +.
f(3) = 81 - 108 = -27
Local min (3, −27); no extremum at 0.
f''(x) = 12x^2 - 24x = 12x(x - 2)
Signs of f″: +, −, +.
f(0) = 0, \; f(2) = 16 - 32 = -16
Inflection points (0, 0) and (2, −16).
Answer: the graph comes down from the upper left, flattens at the origin (an inflection point with a horizontal tangent), keeps falling, changes concavity at (2, −16), reaches its minimum at (3, −27), and rises through (4, 0).
Example 3: A rational function with a horizontal asymptote
Sketch f(x) = \frac{x}{x^2 + 1}.
\lim_{x \to \pm\infty}\frac{x}{x^2 + 1} = 0Domain: all real numbers. Horizontal asymptote y = 0.
f(-x) = -f(x)
Odd. The only intercept is (0, 0).
f'(x) = \frac{1 - x^2}{(x^2 + 1)^2}Quotient rule. Critical numbers ±1; signs −, +, −.
f(-1) = -\frac{1}{2}, \; f(1) = \frac{1}{2}Local min (−1, −½) and local max (1, ½).
f''(x) = \frac{2x(x^2 - 3)}{(x^2 + 1)^3}Quotient rule again, then factor. Zeros at 0 and ±√3.
f(\pm\sqrt{3}) = \pm\frac{\sqrt{3}}{4} \approx \pm 0.433Inflection points at x = −√3, 0 and √3 (f″ changes sign at each).
Answer: the graph hugs y = 0 on the far left, dips to (−1, −½), rises through the origin to (1, ½), then sinks back toward y = 0. It has three inflection points.
Example 4: A rational function with vertical asymptotes
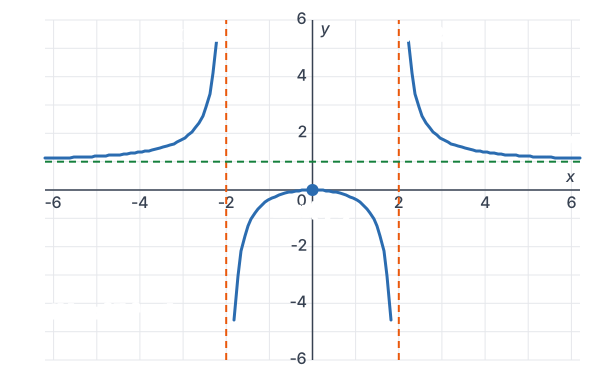
Sketch f(x) = \frac{x^2}{x^2 - 4}.
x^2 - 4 = 0 \Rightarrow x = \pm 2
Domain: x ≠ ±2. Vertical asymptotes x = −2 and x = 2.
\lim_{x \to \pm\infty}\frac{x^2}{x^2 - 4} = 1Horizontal asymptote y = 1. The function is even.
f'(x) = \frac{-8x}{(x^2 - 4)^2}Quotient rule. f′ is + for x below 0 and − above 0 (except at ±2).
f(0) = 0
Local max (0, 0), which is also the only intercept.
f''(x) = \frac{8(3x^2 + 4)}{(x^2 - 4)^3}The numerator is always positive, so the sign comes from (x² − 4)³.
\text{up for } |x| \gt 2, \; \text{down for } |x| \lt 2Concavity changes only at the asymptotes, so there are no inflection points.
Answer: three pieces. Outside the asymptotes the graph is concave up and approaches y = 1 from above. Between them it is a cap with its top at (0, 0), falling to −∞ at both asymptotes.
Example 5: Word problem with a medicine
The concentration of a medicine in the blood t hours after a pill is taken is C(t) = 10te^{-t/2} mg/L, for t \ge 0. Describe its graph: when is the concentration highest, and when is it falling fastest?
C'(t) = 10e^{-t/2} - 5te^{-t/2} = 5e^{-t/2}(2 - t)Product rule, then factor out 5e^(−t/2).
C(2) = 20e^{-1} \approx 7.36C′ changes from + to − at t = 2: maximum.
C''(t) = \frac{5}{2}e^{-t/2}(t - 4)Product rule on C′, then factor.
C(4) = 40e^{-2} \approx 5.41C″ changes from − to + at t = 4: inflection point.
\lim_{t \to \infty} C(t) = 0Horizontal asymptote, by L’Hôpital’s rule.
Answer: the concentration rises to its peak of about 7.36 mg/L at 2 hours. It falls fastest at the inflection point, 4 hours (about 5.41 mg/L), and then levels off toward 0.
Common mistakes
| Mistake | Example of the error | Fix |
|---|---|---|
| Drawing a corner at a local max | A sharp V at (−1, 2) for x³ − 3x | Where f′ = 0, the tangent is horizontal: draw a smooth rounded top. |
| Crossing a vertical asymptote | Connecting the pieces of x²/(x² − 4) across x = 2 | The graph never touches x = ±2. Draw separate pieces. |
| Calling an asymptote an inflection point | Listing x = 2 as an inflection point | f must be defined there. |
| Ignoring concavity between points | Drawing straight segments between key points | Use the f″ signs to bend each piece the right way. |
| Assuming a horizontal asymptote is never crossed | Refusing to let x/(x² + 1) cross y = 0 | A graph can cross a horizontal asymptote; it only has to approach it at the far ends. |
Related methods
Sketching from a graph of f′
You can also work backward: given a graph of f′, the x-intercepts of f′ show where f has horizontal tangents, and the slope of f′ gives the concavity of f. This reverses sketching the graph of a derivative.
Checking with technology
A graphing calculator is a good way to check a sketch, but the analysis tells you why the graph looks the way it does and where the exact turning points are, which a screen can hide.
Practice problems
- Sketch f(x) = x^2 - 4x: give the intercepts, extrema and concavity.
- Sketch f(x) = x^3 - 12x: give the extrema and the inflection point.
- Sketch f(x) = x^3 - 3x^2: give the intercepts, extrema and inflection point.
- Sketch f(x) = x^4 - 2x^2: give the extrema and inflection points.
- Sketch f(x) = \frac{1}{x^2 + 1}: give the asymptote, extremum and inflection points.
- Sketch f(x) = \frac{x + 1}{x - 1}: give the asymptotes, where it increases or decreases, and its concavity.
- Sketch f(x) = xe^x: give the extremum, inflection point and asymptote.
- Sketch f(x) = x - \ln x: give the domain, extremum and concavity.
- Sketch f(x) = x + \sin x on [0, 2π]: where is it increasing, and where is its inflection point?
- A population is P(t) = \frac{100t^2}{t^2 + 25} (in thousands) after t years. Find its long-run value and when it grows fastest.
Show answers
1.
x(x - 4) = 0 \Rightarrow x = 0, 4
Intercepts.
f'(x) = 2x - 4 \Rightarrow x = 2, \; f(2) = -4
Local (and absolute) min (2, −4).
f''(x) = 2 \gt 0
Concave up everywhere.
Answer: an upward parabola through (0, 0) and (4, 0) with its vertex at (2, −4)
2.
f'(x) = 3x^2 - 12 \Rightarrow x = \pm 2
Critical numbers; signs +, −, +.
f(-2) = 16, \; f(2) = -16
Local max (−2, 16), local min (2, −16).
f''(x) = 6x \Rightarrow (0, 0)
Inflection point; concave down for x below 0, up above.
Answer: max (−2, 16), min (2, −16), inflection (0, 0); x-intercepts 0 and ±2√3 ≈ ±3.46
3.
x^2(x - 3) = 0 \Rightarrow x = 0, 3
Intercepts.
f'(x) = 3x^2 - 6x = 3x(x - 2)
Signs +, −, +: max (0, 0), min (2, −4).
f''(x) = 6x - 6 \Rightarrow x = 1, \; f(1) = -2
Inflection point (1, −2).
Answer: max (0, 0), min (2, −4), inflection (1, −2); crosses the x-axis at 0 and 3
4.
f'(x) = 4x(x - 1)(x + 1)
Signs −, +, −, +.
f(0) = 0, \; f(\pm 1) = -1
Local max (0, 0); local mins (±1, −1).
f''(x) = 12x^2 - 4 = 0 \Rightarrow x = \pm\frac{1}{\sqrt{3}}f″ changes sign at both.
f\left(\pm\frac{1}{\sqrt{3}}\right) = \frac{1}{9} - \frac{2}{3} = -\frac{5}{9}Inflection points.
Answer: a W shape with mins (±1, −1), max (0, 0), inflections (±0.577, −5/9)
5.
\lim_{x \to \pm\infty}\frac{1}{x^2 + 1} = 0Horizontal asymptote y = 0; even function.
f'(x) = \frac{-2x}{(x^2 + 1)^2} \Rightarrow (0, 1)Signs +, −: local max.
f''(x) = \frac{6x^2 - 2}{(x^2 + 1)^3} = 0 \Rightarrow x = \pm\frac{1}{\sqrt{3}}Inflection points, at height 1/(1/3 + 1) = 3/4.
Answer: a bell-shaped hump with max (0, 1), inflections (±0.577, 3/4), and y = 0 as the asymptote
6.
x = 1, \; y = 1
Vertical asymptote where x − 1 = 0; horizontal asymptote from the leading coefficients.
f'(x) = \frac{-2}{(x - 1)^2} \lt 0Decreasing on both pieces; no extrema.
f''(x) = \frac{4}{(x - 1)^3}Concave down for x below 1, concave up above 1.
Answer: two decreasing branches around the asymptotes x = 1 and y = 1, like a shifted 1/x
7.
f'(x) = (x + 1)e^x \Rightarrow x = -1
Signs −, +: local min (−1, −1/e).
f''(x) = (x + 2)e^x \Rightarrow x = -2
Inflection point (−2, −2/e²).
\lim_{x \to -\infty} xe^x = 0Asymptote y = 0 on the left.
Answer: min (−1, −0.368), inflection (−2, −0.271), approaches y = 0 on the left and rises steeply on the right
8.
x \gt 0
Domain, because of ln x; as x → 0⁺, f → ∞ (vertical asymptote x = 0).
f'(x) = 1 - \frac{1}{x} \Rightarrow x = 1, \; f(1) = 1Signs −, +: local (and absolute) min (1, 1).
f''(x) = \frac{1}{x^2} \gt 0Concave up everywhere.
Answer: a cup with its lowest point at (1, 1), rising toward the y-axis on the left and slowly on the right
9.
f'(x) = 1 + \cos x \ge 0
Never negative, so f is increasing on all of [0, 2π].
f''(x) = -\sin x = 0 \Rightarrow x = \pi
Concave down on (0, π), up on (π, 2π).
f(\pi) = \pi
Inflection point (π, π), where the tangent is also flat (f′(π) = 0).
Answer: always increasing; inflection point (π, π)
10.
\lim_{t \to \infty}\frac{100t^2}{t^2 + 25} = 100Long-run value: 100 thousand.
P'(t) = \frac{5000t}{(t^2 + 25)^2} \gt 0Quotient rule: always increasing for t \gt 0.
P''(t) = \frac{5000(25 - 3t^2)}{(t^2 + 25)^3} = 0 \Rightarrow t = \frac{5}{\sqrt{3}} \approx 2.89Inflection point: P′ is largest there.
Answer: it levels off at 100,000 and grows fastest at about 2.9 years, when P = 25 (thousand)
Curve sketching FAQ
What are the steps of curve sketching?
Find the domain, intercepts, symmetry and asymptotes; use f′ for increasing, decreasing and extrema; use f″ for concavity and inflection points; then plot the key points and connect them with the right shape.
What does the second derivative tell you about a graph?
Its sign gives the concavity: positive means the graph bends up like a cup, negative means it bends down like a cap.
Do I need a table of values?
Only for a few key points: intercepts, extrema and inflection points. The derivatives tell you the shape between them.
Can a graph cross its horizontal asymptote?
Yes. A horizontal asymptote describes the far ends of the graph only. In the middle, the graph can cross it.
Summary
- From f: domain, intercepts, symmetry, asymptotes.
- From f′: increasing and decreasing intervals, local max and min.
- From f″: concavity and inflection points.
- Plot the key points, then use the signs of f′ and f″ to draw the right shape between them.
Previous lesson: Second Derivative Test
Next lesson: Optimization
Back to the Calculus 1 Index